
|
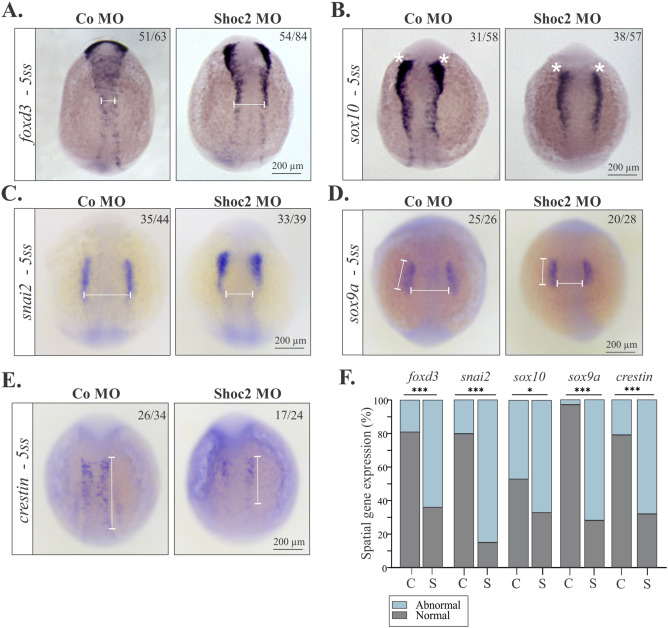
Fig. 2 Molecular defects in NC specification in shoc2 morphants.
Dorsal views of control and shoc2 morphant embryos show expression of NC specifiers foxd3 (A), sox10 (B), snai2 (C), sox9a (D) and crestin (E) in 5-somite-stage embryos. White lines and asterisks indicate the parameters that were assessed to determine the changes in expression of foxd3, sox10, snai1, sox9a and crestin. Average distances of ∼92 μm (A), ∼279 μm (C), ∼193 μm (D, vertical) and ∼193 μm (D, horizontal), and ∼455 μm (E) were designated as “normal” expression patterns, while average distances of ∼167 μm (A), ∼174 μm (C), ∼157 μm (D, vertical) and ∼198 μm (D, horizontal), and ∼194 μm (E) designated as “abnormal” expression patterns. The graph (F) shows the frequency of observed expression patterns from at least three independent experiments, C- control morphants, S- Shoc2 morphants. The total number of embryos used in the statistical analysis is indicated on each image. Statistically significant differences between shoc2 MO and control MO according to the Pearson’s chi-squared test are indicated by ∗p<0.05, ∗∗p<0.01, ∗∗∗p<0.001.
Reprinted from Developmental Biology, 492, Norcross, R.G., Abdelmoti, L., Rouchka, E.C., Andreeva, K., Tussey, O., Landestoy, D., Galperin, E., Shoc2 controls ERK1/2-driven neural crest development by balancing components of the extracellular matrix, 156-171, Copyright (2022) with permission from Elsevier. Full text @ Dev. Biol.