
|
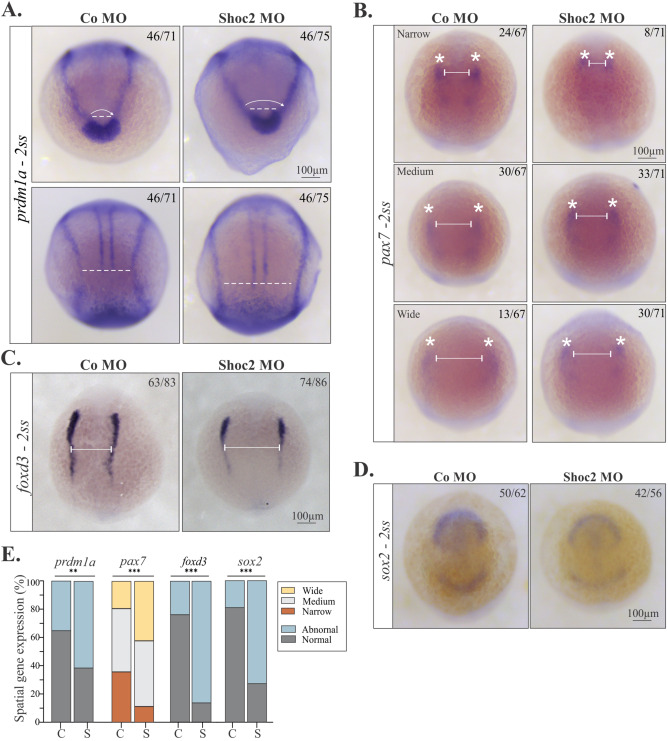
Fig. 1 Analysis of gene expression at NPB of shoc2 morphants.
Dorsal views of control and shoc2 morphant embryos showing expression of prdm1a (A), pax7 (B), foxd3 (C), and sox2 (D) in 2-somite-stage embryos. Aberrant expression patterns of prdm1a, pax7, foxd3, and sox2 are evident in shoc2 morphants. Lines indicate parameters that were assessed to determine the abnormal expression patterns. Average distances of ∼109 μm (A, top panel), ∼304 μm (A, bottom panel), and ∼275 μm (C) were designated as “normal” expression patterns, while average distances of ∼149 μm (A, top panel), ∼474 μm (A, bottom panel), ∼325 μm (C) designated as “abnormal” expression patterns. In B, the expression patterns are designated as follows: narrow ∼187 μm, medium ∼254 μm, wide ∼355 μm. The graph (E) shows the frequency of observed patterns from at least three independent experiments, C- control morphants, S- Shoc2 morphants. The total number of embryos is indicated on each image. Statistically significant differences between shoc2 MO and control MO according to the Pearson’s chi-squared test are indicated by ∗p<0.05, ∗∗p<0.01, ∗∗∗p<0.001.
Reprinted from Developmental Biology, 492, Norcross, R.G., Abdelmoti, L., Rouchka, E.C., Andreeva, K., Tussey, O., Landestoy, D., Galperin, E., Shoc2 controls ERK1/2-driven neural crest development by balancing components of the extracellular matrix, 156-171, Copyright (2022) with permission from Elsevier. Full text @ Dev. Biol.