
|
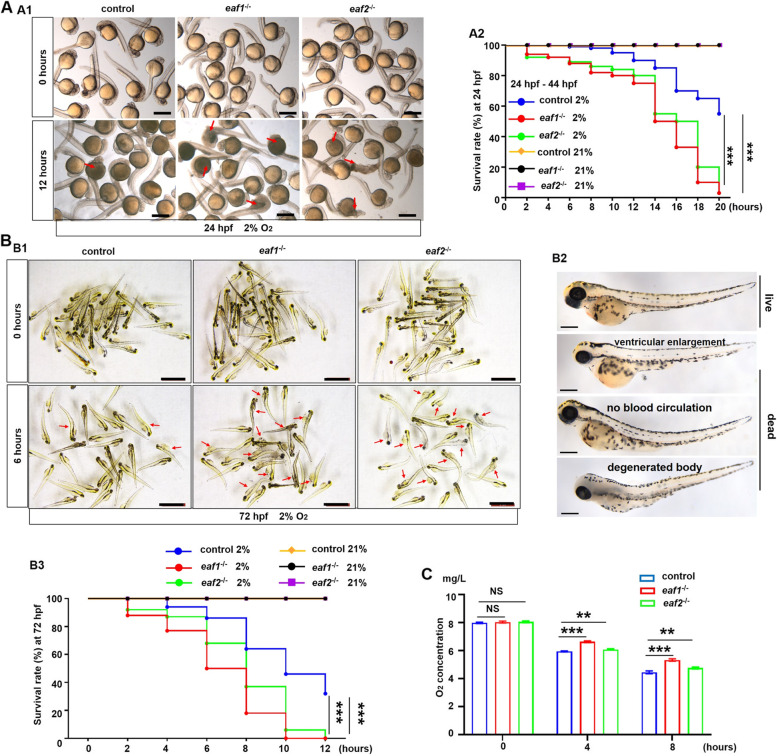
Fig. 1
Effects of eaf1/2 deficiency on hypoxia tolerance in zebrafish. A Representative images of eaf1−/−, eaf2−/−, and WT embryos exposed to hypoxia (2% O2) beginning at 24 hpf for 12 h and dead larvae were marked by red arrows (A1), and the survival rate curves of eaf1−/−, eaf2−/− and wild-type (WT) embryos (A2). B Representative images of eaf1−/−, eaf2−/−, and WT larvae exposed to hypoxia beginning at 72 hpf for 12 h (B1), the representative images of living and dead larvae (marked by red arrows) (B2), and the survival rate curves of each group (B3). The oxygen concentration of the hypoxia workstation was adjusted to 2% before the experiment. The dead larvae were counted once every two hours, 30 embryos/larvae per group with three replicates. C Oxygen consumption rate was lower in eaf1−/− and eaf2−/− than in their WT siblings (6 mpf). Each experiment was repeated at least three times, with similar results for two or three replicates, and a representative result was shown. Data are mean ± SD. Hpf, hours post fertilization; dpf, days post fertilization; mpf, months post fertilization. B2, lateral view, anterior to the left. *P < .05, **P < .01, ***P < .001. NS, not significant. Scale bar = 2 mm (A1 and B1) and 100 μm (B2)