
FIGURE 7
- ID
- ZDB-IMAGE-230331-64
- Genes
- Publication
- Raterman et al., 2023 - Disruption of the foxe1 gene in zebrafish reveals conserved functions in development of the craniofacial skeleton and the thyroid
- All Figures
- Figures for Raterman et al., 2023
|
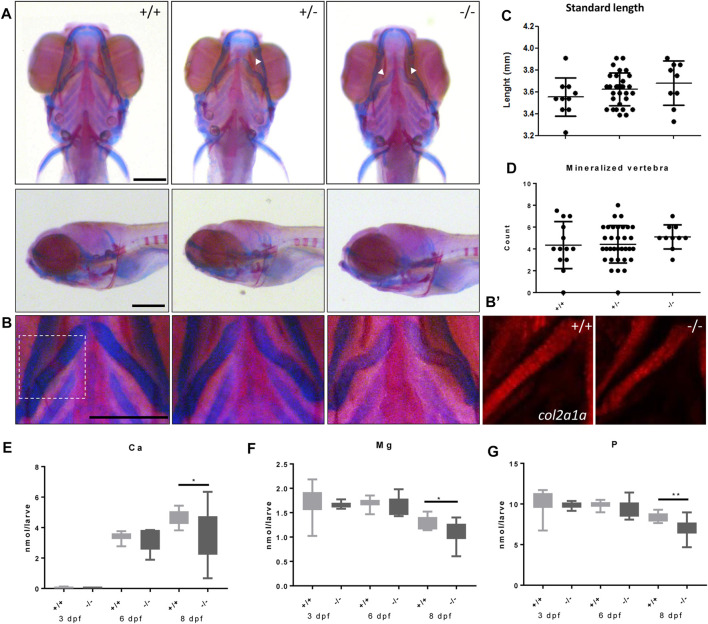
FIGURE 7
Malformed ceratohyal cartilage and reduced content of Ca, Mg and P in foxe1 mutants. (A) Representative images of wild types and foxe1 heterozygous- and homozygous mutants, ventral and lateral view. (B) High magnification images of ceratohyal phenotype. (B′) Col2a1a positive cells in the in ceratohyal. (C) Standard length at 8 dpf. (D) Count of mineralized vertebrae in foxe1 mutants versus wild types at 8 dpf. (E–G) Molar calcium, magnesium and phosphorus content in foxe1 mutants versus wild type larvae during early skeletal development three to 8 dpf. n = 10–33. Scale bar 200 µm. Data were assessed for normality with the D’Agostino-Pearson normality test. Normally distributed data were analyzed for statistical differences using a one-way ANOVA and post-hoc Tukey test or unpaired t-test. Non-parametric data were compared with a Kruskal–Wallis test with post-hoc Dunn’s Multiple comparison test or Mann-Whitney test. Error bars indicate standard deviation.