
Image
|
Figure Caption
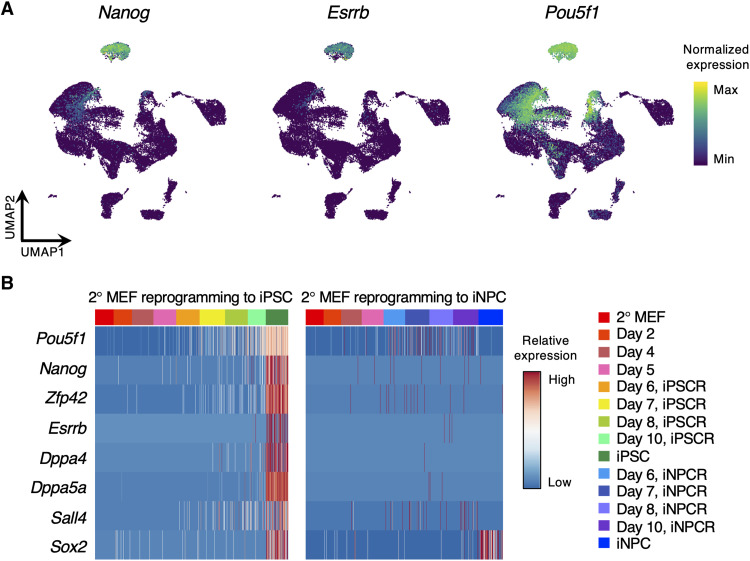
Fig. 6
The expression of pluripotency markers during OSKM-mediated reprogramming.
(A) UMAP plots of cells during iPSC or iNPC reprogramming showing the expression of pluripotency marker genes. (B) Heatmaps showing the expression of the pluripotency marker gene signatures in cells from iPSCR and iNPCR. Reprogramming day is indicated by colors in the upper bar.
Acknowledgments
This image is the copyrighted work of the attributed author or publisher, and
ZFIN has permission only to display this image to its users.
Additional permissions should be obtained from the applicable author or publisher of the image.
Full text @ Sci Adv