
|
Figure 6
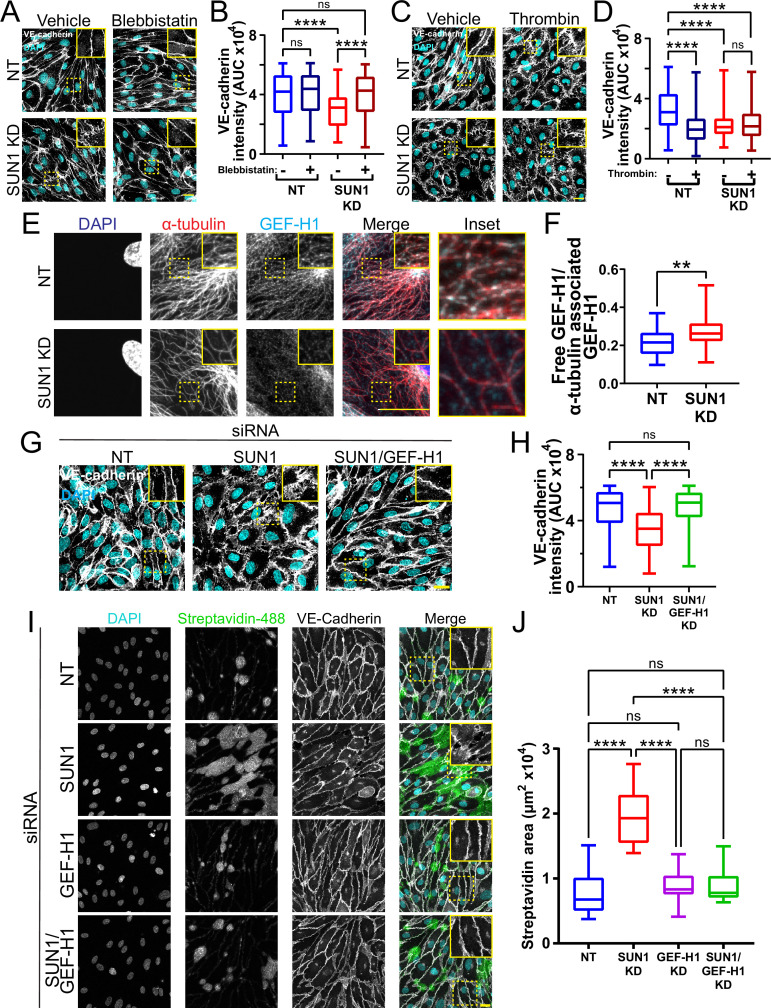
(A) Representative images of human umbilical vein endothelial cells (HUVEC) with indicated siRNAs and indicated treatments. Endothelial cells were stained for DAPI (cyan, DNA) and VE-cadherin (white, junctions). Insets show junctions. Scale bar, 20 µm. (B) Quantification of VE-cadherin line scans for treatments shown in (A). n=159 junctions (non-targeting [NT], vehicle), 154 junctions (NT, blebbistatin), 151 junctions (SUN1 knockdown [KD], vehicle), and 149 junctions (SUN1 KD, blebbistatin) compiled from three replicates. ns, not significant; ****, p<0.0001 by two-way ANOVA with Tukey’s multiple comparisons test. (C) Representative images of HUVEC with indicated siRNAs and indicated treatments. Endothelial cells were stained for DAPI (cyan, DNA) and VE-cadherin (white, junctions). Insets show junctions. Scale bar, 20 µm. (D) Quantification of VE-cadherin line scans for treatments shown in (C). n=75 junctions (NT, vehicle), 70 junctions (NT, thrombin), 71 junctions (SUN1 KD, vehicle), and 73 junctions (SUN1 KD, thrombin) compiled from three replicates. ns, not significant; ****, p<0.0001 by two-way ANOVA with Tukey’s multiple comparisons test. (E) Representative images of HUVEC with indicated siRNAs. Endothelial cells were stained for DAPI (blue, DNA), α-tubulin (red, microtubules), and GEF-H1 (cyan). Insets show α-tubulin and GEF-H1 colocalization. Scale bar, 20 µm. (F) Quantification of free GEF-H1 normalized to α-tubulin associated GEF-H1 shown in (E). n=30 cells (NT) and 30 cells (SUN1 KD) compiled from three replicates. **, p<0.01 by Student’s two-tailed unpaired t-test. (G) Representative images of HUVEC with indicated siRNAs and indicated treatments. Endothelial cells were stained for DAPI (cyan, DNA) and VE-cadherin (white, junctions). Insets show junctions. Scale bar, 20 µm. (H) Quantification of VE-cadherin line scans from KD shown in (G). n=169 junctions (NT), 166 junctions (SUN1 KD), 170 junctions (SUN1/GEF-H1 KD) compiled from three replicates. ns, not significant; ****, p<0.0001 by one-way ANOVA with Tukey’s multiple comparisons test. (I) Representative images of HUVEC with indicated siRNAs cultured on biotinylated fibronectin and treated with streptavidin upon confluence. Endothelial cells were stained for DAPI (cyan, DNA), streptavidin (green), and VE-cadherin (white, junctions). Insets show junctions. Scale bar, 20 µm. (J) Quantification of streptavidin area shown in (I). n=15 ROIs (NT), 15 ROIs (SUN1 KD), 15 ROIs (GEF-H1 KD), and 15 ROIs (SUN1/GEF-H1 KD) compiled from three replicates. ns, not significant; ****, p<0.0001 by one-way ANOVA with Tukey’s multiple comparisons test. For all graphs, boxes represent the upper quartile, lower quartile, and median; whiskers represent the minimum and maximum values.
SUN1 regulates endothelial cell contractility and exerts its effects on junctions through the microtubule-associated GEF-H1.