
|
Figure 4
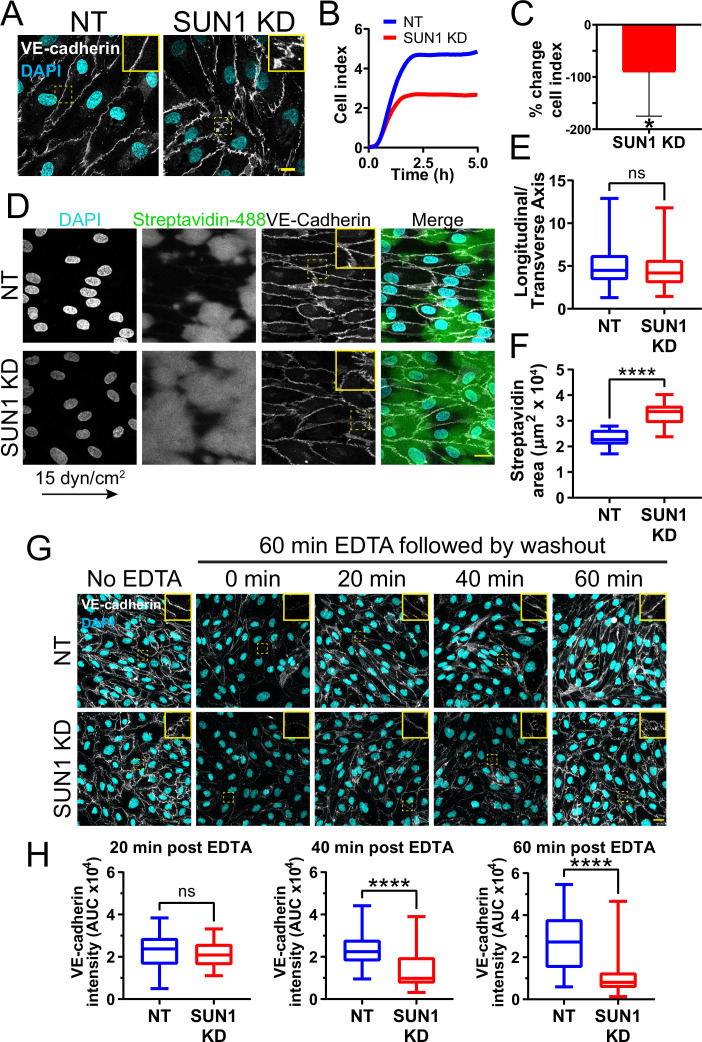
(A) Representative images of human umbilical vein endothelial cells (HUVEC) with indicated knockdowns (KD) in monolayers. Endothelial cells were stained for DAPI (cyan, DNA) and VE-cadherin (white, junctions). Insets show junctions. Scale bar, 10 µm. (B) Representative graph of impedance measured by real time cell analysis (RTCA). (C) Quantification of % change in cell index for RTCA measured at 5 hr. Normalized to non-targeting (NT) cell index. n=5 replicates. *, p<0.05 by Student’s two-tailed unpaired t-test. (D) Representative images of HUVEC with indicated siRNAs plated on biotinylated fibronectin and exposed to 15 dyn/cm2 shear stress for 72 hr then treated with streptavidin. Endothelial cells were stained for DAPI (cyan, DNA), streptavidin (green), and VE-cadherin (white, junctions). Arrow indicates flow direction. Insets show junctions. Scale bar, 20 µm. (E) Quantification of cell alignment shown in (D). n=59 cells (NT) and 73 cells (SUN1 KD) compiled from three replicates. (F) Quantification of streptavidin area shown in (D). n=15 ROIs (NT) and 15 ROIS (SUN1 KD) compiled from three replicates. (G) Representative images of HUVEC with indicated siRNAs showing adherens following EDTA washout. Endothelial cells were stained for DAPI (cyan, DNA) and VE-cadherin (white, junctions). Insets show junctions. Scale bar, 20 µm. (H) Quantification of VE-cadherin line scans at 20, 40, and 60 min post EDTA washout in (G). 20 min: n=31 junctions (NT) and 23 junctions (SUN1 KD); 40 min: n=49 junctions (NT) and 33 junctions (SUN1 KD); 60 min: n=33 junctions (NT) and 33 junctions (SUN1 KD) compiled from three replicates. ns, not significant; ****, p<0.0001 by Student’s two-tailed unpaired t-test. For C, error bars represent standard deviation. For E, F, and H, boxes represent the upper quartile, lower quartile, and median; whiskers represent the minimum and maximum values.
SUN1 stabilizes endothelial cell-cell junctions and regulates junction integrity.