
|
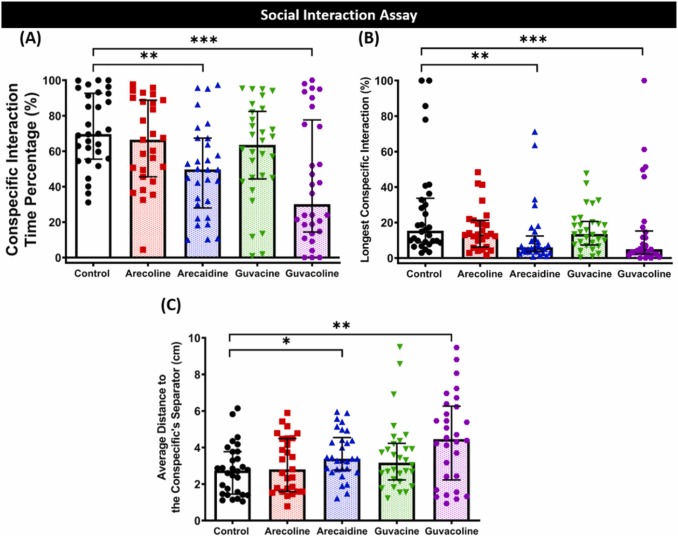
Fig. 5 Fig. 5. Comparison of behavior endpoints between untreated control, arecoline, arecaidine, guvacine, and guvacoline exposed zebrafish in social interaction tests. (A) Conspecific interaction time percentage, (B) longest conspecific interaction, and (C) average distance to the conspecific’s separator. The data are expressed as the median with interquartile range and were analyzed by Kruskal-Wallis test continued with uncorrected Dunn’s test (n = 30 for the control, guvacine, and guvacoline treatment groups; n = 29 for arecaidine treatment groups, n = 27 for arecoline treatment groups, * P < 0.05, ** P < 0.01, *** P < 0.001, **** P < 0.0001).