
Image
|
Figure Caption
Fig. 5
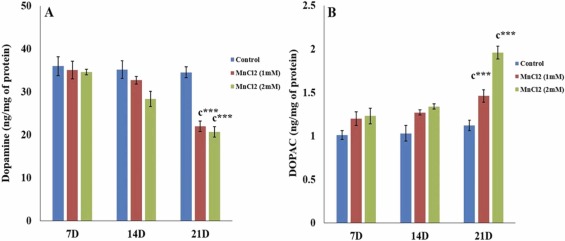
Fig. 5. Evaluation of MnCl2 chronic exposure effect on ZF to induce PD-like symptom (DA and DOPAC level), Values are expressed as Mean ± SEM, n = 8. Significant difference * p < 0.05,** p < 0.01,*** p < 0.001, a Significant when compared to control group on 7th day, b Significant when compared to control group on 14th day, c Significant when compared to control group on 21st day.
Acknowledgments
This image is the copyrighted work of the attributed author or publisher, and
ZFIN has permission only to display this image to its users.
Additional permissions should be obtained from the applicable author or publisher of the image.
Full text @ Biomed. Pharmacother.