
Image
|
Figure Caption
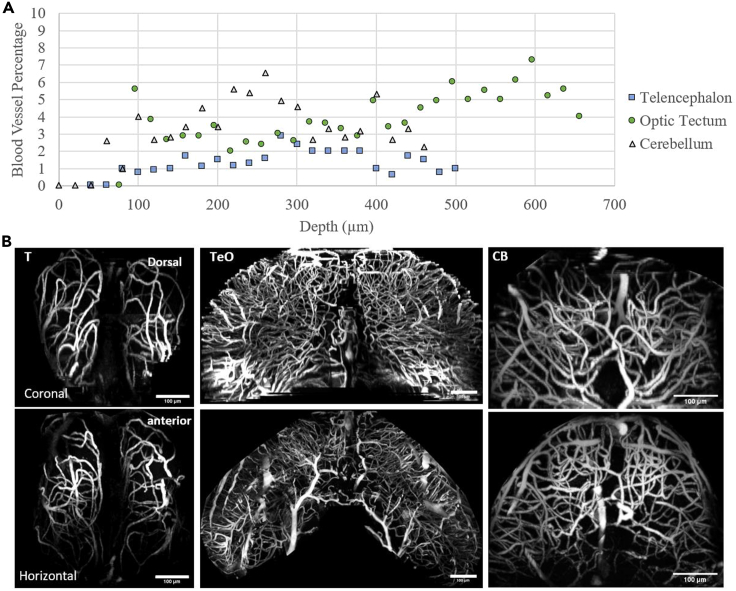
Fig. 5
Characterization of blood vessel density in different regions of the brain
(A) Blood volume percentage in telencephalon, optic tectum, and cerebellum characterized at various depths (see STAR Methods).
(B) Maximum projection of vasculature in telencephalon (T), optic tectum (TeO), and cerebellum (CB). Coronal and horizontal views of vasculature are shown in top and bottom rows, respectively. Dorsal and anterior direction of each row is marked on the leftmost image.
Acknowledgments
This image is the copyrighted work of the attributed author or publisher, and
ZFIN has permission only to display this image to its users.
Additional permissions should be obtained from the applicable author or publisher of the image.
Full text @ iScience