
|
Fig. 6
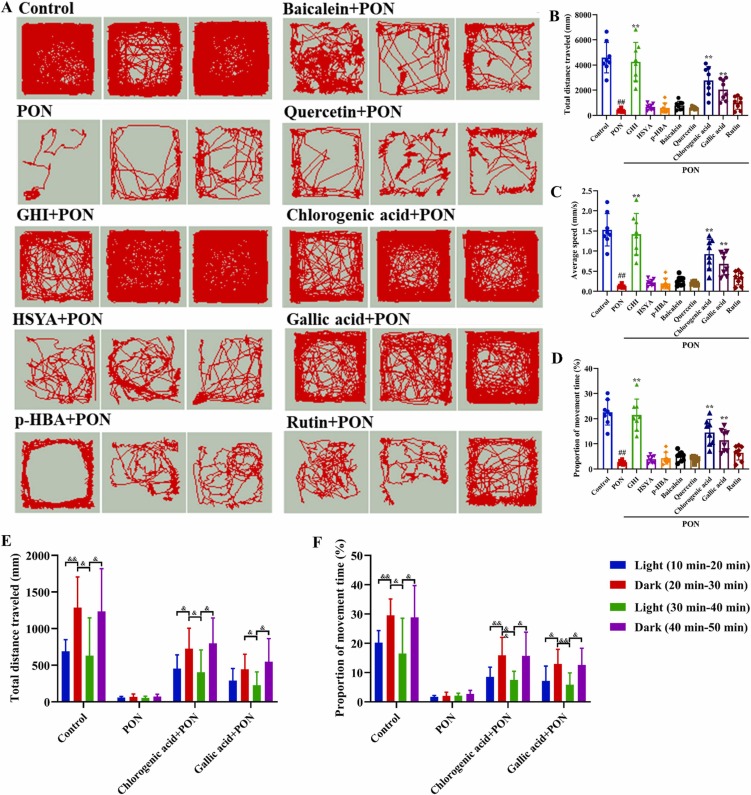
Fig. 6. Screening of active compounds of GHI in PON-stimulated zebrafish ischemic stroke model. (A) Representative images of motion tracking of the main chemical components in GHI. (B-D) Quantitative analysis of total movement distance (B), average speed (C), and proportion of movement time (D). (E) Quantitative results of total movement distance (E) and proportion of swimming time (F) of zebrafish in response to light-to-dark photoperiod stimulation. N = 8 for each group. Data are presented as the mean ± SD. #p < 0.05, and ##p < 0.01 versus the control group; *p < 0.05, and **p < 0.01 versus the PON group. &p < 0.05, and &&p < 0.01 versus darkness. PON, ponatinib; GHI, Guhong injection; HSYA, hydroxysafflor yellow A; p-HBA, p-hydroxy benzaldehyde.