
|
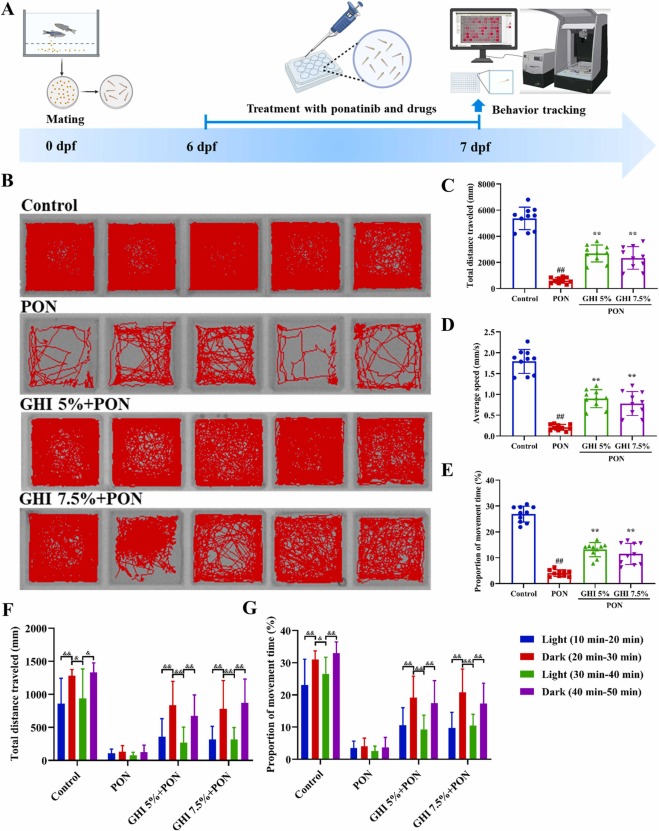
Fig. 4
Fig. 4. GHI prevented the motor impairment in a zebrafish ischemic stroke model. (A) Schematic diagram of experimental design. (B) Representative images of motion tracking. (C-E) Bar graph representing the quantitative results of total movement distance (C), average speed of swimming (D), and proportion of movement time (E). (F-G) Quantification of total movement distance (F) and proportion of movement time (G) of zebrafish in response to light-to-dark photoperiod stimulation. N = 10 for each group. Data are displayed as the mean ± SD. #p < 0.05, and ##p < 0.01 versus the control group; *p < 0.05, and **p < 0.01 versus the PON group. &p < 0.05, and &&p < 0.01 versus darkness. PON, ponatinib; GHI, Guhong injection.