
|
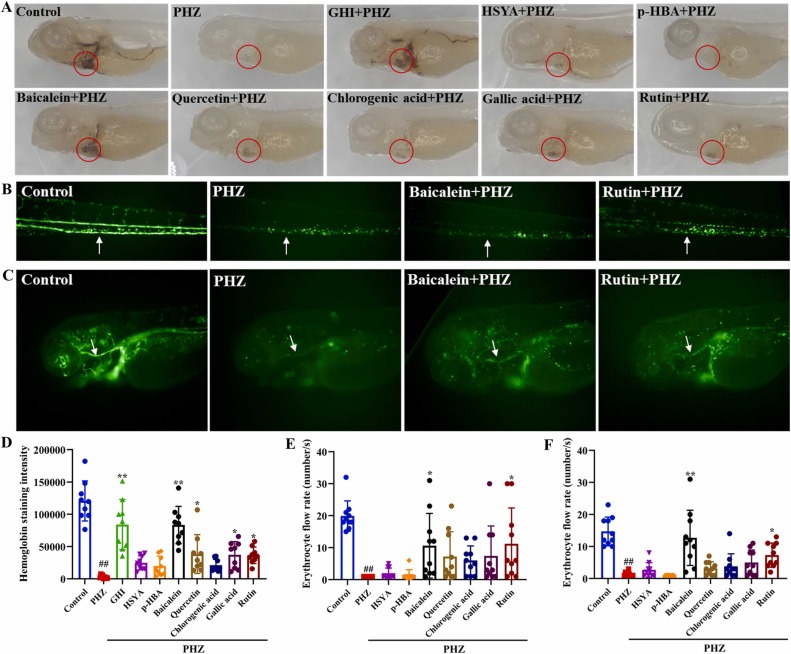
Fig. 3
Fig. 3. Screening for active substances of GHI in PHZ-induced zebrafish thrombosis model. (A) Representative images of active compounds screening based on the hemoglobin levels in the heart of zebrafish embryos (circled by red line). (B-C) Representative images of the regulatory effects of baicalein and rutin on the peripheral (B) and cerebral blood flow (C). (D-F) Quantification of hemoglobin staining (D, n = 9), caudal vein blood flow (E, n = 10), and brain primary cephalic sinus blood flow (F, n = 10). Areas for blood flow quantification were indicated by white arrows. Data are shown as the mean ± SD. #p < 0.05, and ##p < 0.01 versus the control group; *p < 0.05, and **p <0.01 versus the PHZ group. PHZ, phenylhydrazine; GHI, Guhong injection; HSYA, hydroxysafflor yellow A; p-HBA, p-hydroxy benzaldehyde.