
Image
|
Figure Caption
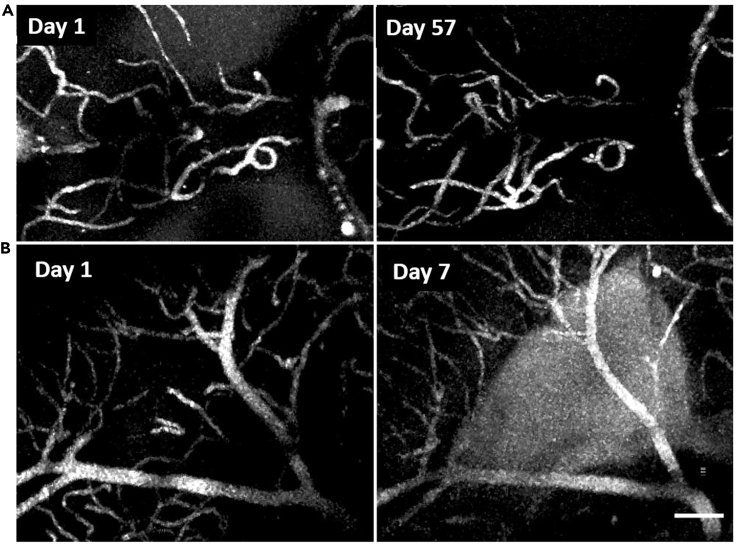
Fig. 3
Longitudinal imaging of midbrain vasculature
(A and B) Maximum projection of a subset of vasculature in one animal at two timepoints separated by 57 days (A) and in a second animal separated by 7 days (B). Images in A are within the cerebellar-tectal boundary and in D within the optic tectum. Scale bar in lower right frame represents 100 μm for all frames.
Acknowledgments
This image is the copyrighted work of the attributed author or publisher, and
ZFIN has permission only to display this image to its users.
Additional permissions should be obtained from the applicable author or publisher of the image.
Full text @ iScience