
|
Fig. 1
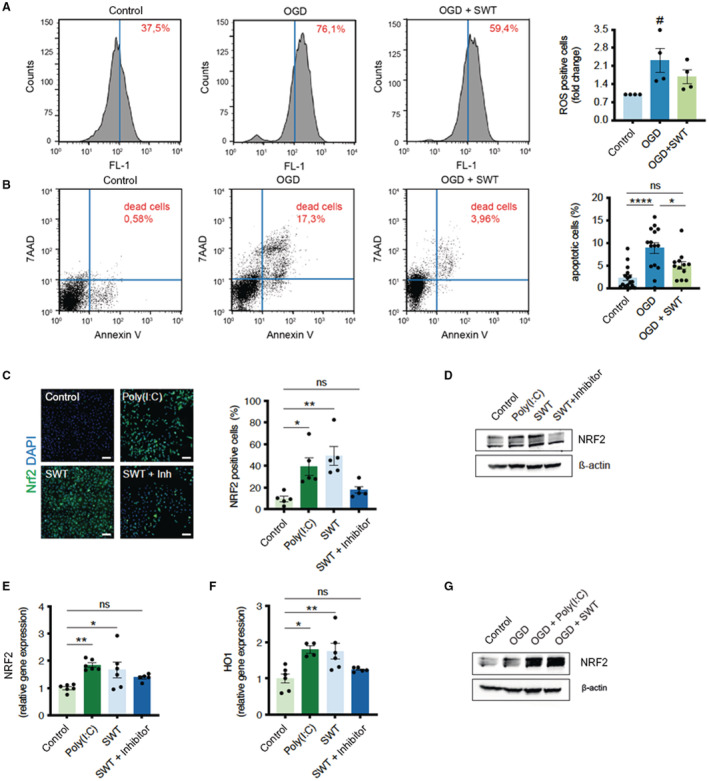
A, SH‐SY5Y cells underwent oxygen/glucose deprivation for 4 hours. After 24 hours of reoxygenation, the amount of reactive oxygen species was detected by H2DCFDA via FACS analysis. Shock wave–treated cells showed reduced oxidative stress. Data are means±SEM. # P<0.05. n=4. B, FACS analysis of Annexin V/PI staining to determine apoptotic and necrotic cell death upon oxygen/glucose deprivation. Shock wave–treated cells showed greater survival in this setting. Data are means±SEM. *P<0.05; ****P<0.0001. n=16 (Control), n=15 (OGD), n=12 (OGD + SWT). C, Immunofluorescence staining revealed an increased number of NRF2 positive SH‐SY5Y cells after treatment with shock waves or Toll‐like receptor 3 agonist Poly(I:C). Addition of a Toll‐like receptor 3 inhibitor abolished shock wave‐mediated NRF2 expression. Scale bar: 100 μm. Data are means±SEM. *P<0.05; **P<0.01. n=5. D, Immunoblot analysis of NRF2 protein expression upon treatment with shock waves and Poly(I:C). Inhibition of TLR3 prevented NRF2‐expression upon SWT. E and F, Quantitative polymerase chain reaction analysis revealed increased gene expression levels of NRF2 and its downstream target HO‐1 (heme oxygenase‐1) upon SWT and treatment with TLR3 agonist Poly(I:C). Data are means±SEM. *P<0.05; **P<0.01. n=6. G, SH‐SY5Y cells undergoing oxygen/glucose deprivation showed increased protein expression of antioxidative NRF2 when pretreated with shock waves or Poly(I:C). Statistical comparison by ranks: Kruskal–Wallis test (A). Statistical comparisons between multiple groups: 1‐way ANOVA with Tukey post hoc analysis (B, C, E, F). OGD indicates oxygen/glucose deprivation; and SWT, shock wave therapy.