
Image
|
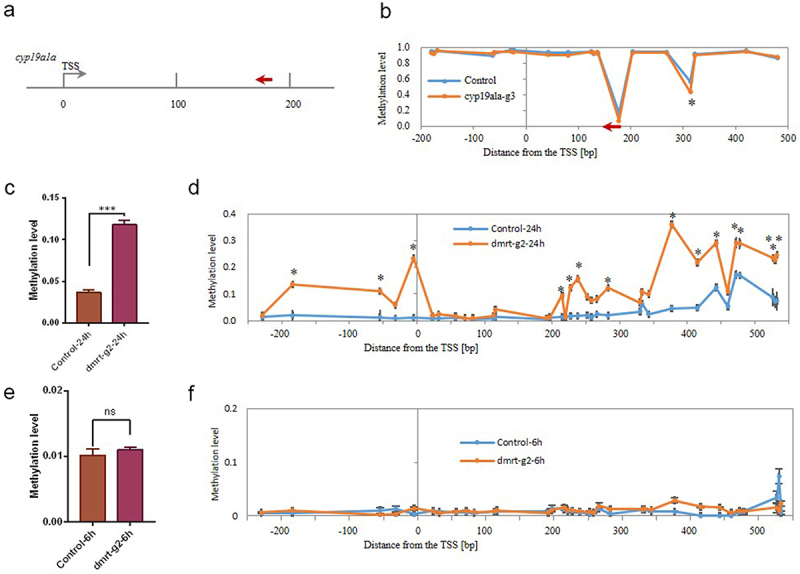
Figure Caption
Figure 2.
(a) Illustration of the locations of the gRNA designed for targeting the TSS region of the cyp19a1a gene; (b) Methylation levels of individual CpGs in the TSS region of the cyp19a1a gene; (c) The average DNA methylation level of target locus within the dmrt1 TSS region at 24 hpf. (d) Methylation levels of individual CpGs in the TSS region of the dmrt1 gene at 24 hpf. (e) The average DNA methylation level of target locus within dmrt1tss region at 6 hpf. (f) Methylation levels of individual CpGs in the TSS region of the dmrt1 gene at 6 hpf. The asterisk indicates statistical significance. (* p<0.05).
Acknowledgments
This image is the copyrighted work of the attributed author or publisher, and
ZFIN has permission only to display this image to its users.
Additional permissions should be obtained from the applicable author or publisher of the image.
Full text @ Epigenetics