
Fig. 3
- ID
- ZDB-IMAGE-230324-19
- Publication
- Odelin et al., 2023 - Variations in the poly-histidine repeat motif of HOXA1 contribute to bicuspid aortic valve in mouse and zebrafish
- All Figures
- Figures for Odelin et al., 2023
|
Fig. 3
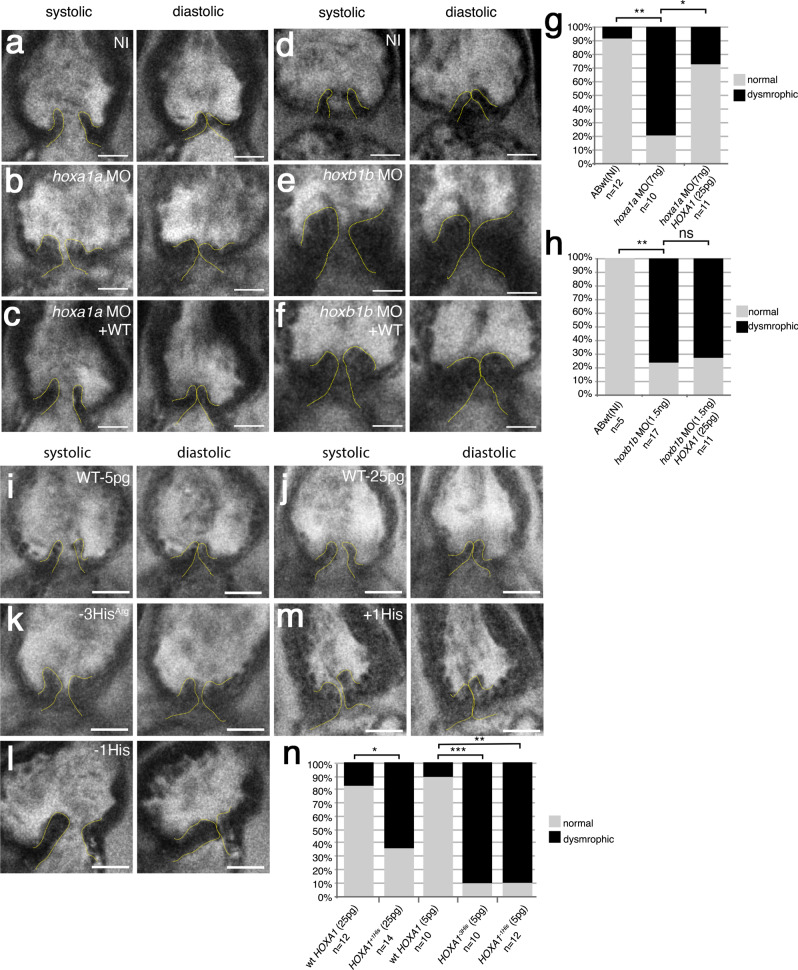
Two-photon images of aortic valves in 7 dpf zebrafish larvae labeled with BODIPY. a, d Representative image of aortic valve leaflets in a wild-type, non-injected larvae (ABwt, NI), valves are outlined with a dashed yellow line (a: n = 12; d: n = 5). bhoxa1a morphant (n = 10). choxa1a morphant co-injected with wild-type human HOXA1 mRNA (n = 11). ehoxb1b morphant (n = 17). fhoxb1b morphant co-injected with wild-type human HOXA1 mRNA (n = 11). g Graph showing quantification of aortic valve defects observed in 7 dpf larvae after knockdown of hoxa1a. Approximatively 80% of hoxa1a morphants exhibited aortic valve defects (**p = 0.0015; *p = 0.03). HOXA1 human mRNA rescued the hoxa1a morpholino aortic valve phenotype. h Graph showing quantification of aortic valve defects observed in 7 dpf larvae after knockdown of hoxb1b (**p = 0.0048). human HOXA1 mRNA does not rescue the hoxb1b morpholino aortic valve phenotype. i, j Representative images of aortic valve leaflets after injection of WT human HOXA1 mRNA (WT) at 5 pg (n = 10) or 25 pg (n = 12), respectively. k Injection of the −3HisArg variant of human HOXA1 at 5 pg (n = 10). l Injection of the −1His variant of human HOXA1 at 5 pg (n = 12). m Injection of the +1His variant of human HOXA1 at 25 pg (n = 14). n Graph showing quantification of aortic valve defects observed in 7 dpf larvae after injection of the variants of human HOXA1 (***p = 0.001; **p = 0.0037; *p = 0.021). Statistical values were obtained using Fisher exact test. Scale bars: 20 μm. Source data are provided as a Source data file.