
|
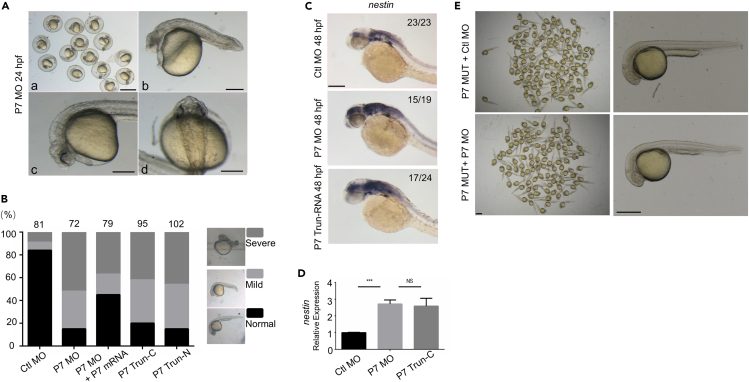
Figure 4
Knocking down pcdh7b caused defects in zebrafish embryos
(A) Phenotypes of P7 MO injected zebrafish embryos at 24 hpf. a, Scale bar = 1 mm; b-d, Scale bar = 100 μm.
(B) Left panel indicates ratio of phenotypes in each group injected with Ctl MO (2 ng/μL, n = 81), P7 MO (2 ng/μL, n = 72), P7 MO + P7 mRNA (P7 MO 2 ng/μL +P7 mRNA 60 ng/μL, n = 79), P7 TRUN-C (120 ng/μL, n = 93), P7 TRUN-N (120 ng/μL, n = 102). Right panel shows different phenotype of MO injected embryos at 24 hpf.
(C) In situ hybridization analysis detected nestin gene in embryos pre-injected with Ctl MO, P7 MO or P7 TRUN-RNA. Scale bar = 200 μm.
(D) Real-time fluorescence quantitative PCR analysis showed the relative expression nestin genes in embryos at 48 hpf, embryos were pre-injected with Ctl MO, P7 MO or P7 TRUN-C (mean ± s.e.m, n = 3, Student’s t test: ∗∗∗p < 0.001, NS = not significant).
(E) Phenotypes of P7 MUT injected with Ctl MO or P7 MO zebrafish embryos at 24 hpf. Left, Scale bar = 1 mm; Right, Scale bar = 500 μm. Ctl MO: control MO, P7 MO: pcdh7b MO, P7 mRNA: pcdh7b mRNA, P7 TRUN: pcdh7b truncated mRNA.