
Image
|
Figure Caption
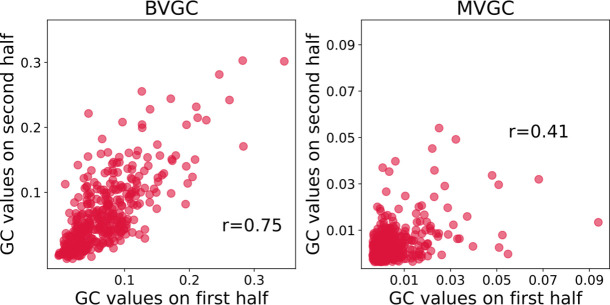
Figure 8—figure supplement 5.
Correlation of Granger causality values using the first and second halves of the hindbrain data (N = 41 neurons). The correlation of r = 0.76 for the two halves assesses that BVGC (left) can be applied to the whole time series (1744 time steps). The correlation between the MVGC analyses of the halves of the hindbrain dataset (right) is low, and in this case, 872 time points are not sufficient to infer reliable MVGC results.
Acknowledgments
This image is the copyrighted work of the attributed author or publisher, and
ZFIN has permission only to display this image to its users.
Additional permissions should be obtained from the applicable author or publisher of the image.
Full text @ Elife