
|
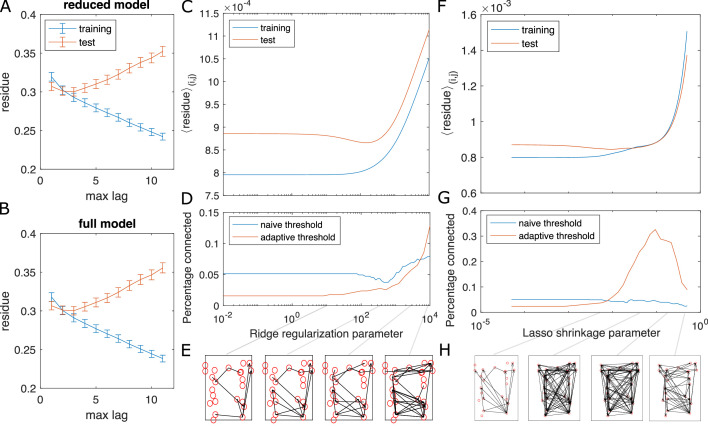
Figure 8—figure supplement 3.
Test for overfitting and information flow from regularized GC on zebrafish hindbrain (N = 23 neurons). (A, B) Residues of the VAR model with different max lags for training (the first 2/3 of the data) and test (last 1/3 of the data) datasets, computed for and averaged across each possible neuron pair (i, j) for neuron j driving neuron i. The overlap between the training and test curves for max lag less than or equal to 3 shows the choice of max lag l = 3 does not overfit. Error bars are standard error of the mean across all possible pairs of neurons. (C) The training and testing residue using ridge regularization for the full model shows a preferred ridge regularization parameter ~ 2 x 10² (D) The percentage of connection after GC analysis shows a decrease at the preferred ridge regularization parameter, if we use the naive threshold. Using adaptive threshold increases the connection. (E) Shows examples of information flow at different ridge regularization parameters, using the adaptive threshold. (F–H) Same as (C–E), using LASSO regularization.