
|
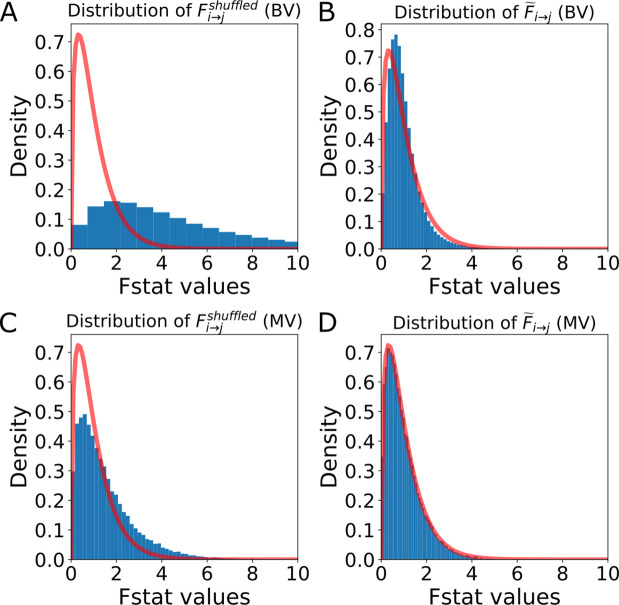
Figure 8—figure supplement 2.
Distribution of the F-statistics of the shuffled data before and after re-scaling. (A) Original distribution of the BVGC F-statistics of shuffled data, ℱshuffled i→j. It has a shifted support that is larger than that of the F-distribution (red curve), meaning that if we use the original F-test based on the F-distribution as a null model, even if there are no Granger-causal links between two neurons, we will classify the link as significant. (B) For each neuron pair, (i,j) the distribution ℱshuffled i→j is well-described by a constant-rescaled F-distribution. Applying an adaptive threshold on F i→j can be simplified to applying the original threshold on the normalized, F~ i→j defined by dividing the naive F-statistics with the expectation value of the F-statistics generated by the shuffled data (F ~