
|
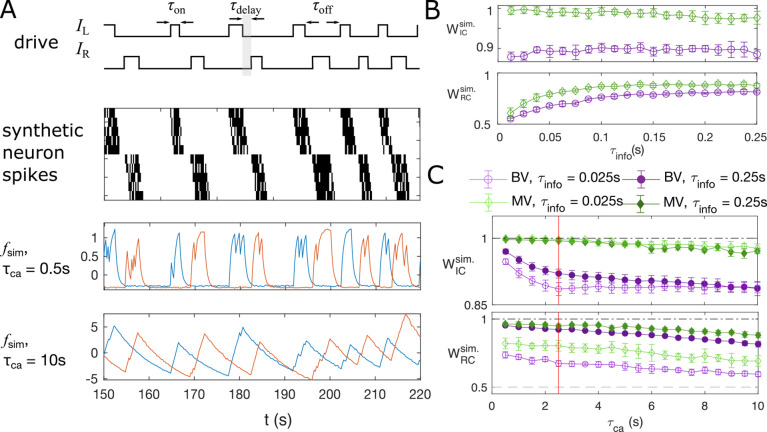
Figure 5.
(A) Example traces of the synthetic data for two chains of five neurons (N = 10 neurons for the whole system). The common stimuli, IL and IR, are sampled using the empirically observed on- and off-durations for the neuron bursts (τon and τoff). The time delay of the onset of the right stimulus IR from the offset of the left stimulus IL is also sampled using empirical distribution. Each synthetic data is generated for the duration of 1000s. (B) Success of information flow retrieval, measured by the weight of the ipsilateral GC links, WIC, and the weight of rostral-to-caudal links, WRC, as a function of the information propagation time scale τinfo, evaluated at the empirical time scales τca = 2.5s, τsampling = 0.25s, and biologically responsible base spike rate λ0=32s−1. Results from bivariate GC are plotted in purple, and results from multivariate GC are in green. (C) Success of information flow retrieval for τinfo = 0.025s and τinfo = 0.25s for synthetic data with different calcium decay time constants. Greater calcium decay constants lead to worse information retrivals. Errorbars represents standard deviations across 10 realizations of synthetic data. The empirical calcium time scale τca is indicated by the red vertical line. Error bars in panel (B) and (C) are standard deviation across 10 random realizations of the synthetic data.