Image
Figure Caption

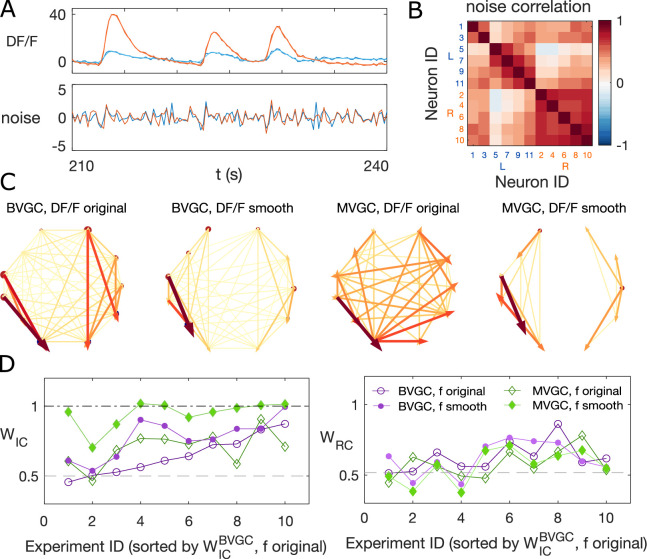
Figure 4—figure supplement 1. Smoothing the calcium imaging signal can improve the accuracy of GC.(A) We smooth the noisy calcium imaging signal f = DF/F using total-variational regularization (see Materials and Methods), and plot the example traces of the original and the maootherned neuronal signals, and the residual noise, using the dataset f3t2(N = 11 neurons) from De Vico Fallani et al., 2014. (B) The Pearson correlation coeffecient show the residual noise is correlated, (C) GC networds constructed using the original noisy calcium signal compared to ones using the smoothed signal for motorneurons. (D) Weight of ipsilateral GC links, WIC and the weight of rostal-to-cordal links, WRC, for the original calcium signals and smoothened signals. We expect WIC ~ 1 and a null model with no bias for where the links are placed will have WIC = 0.5. The x-axis is sorted using the WIC value for bivariate GC analysis with the original calcium data. Data points are connected with lines to guide the eye. The bivariate GC results are plotted with purple circles, and the multivariate GC results with green diamond. GC analysis results using the original noisy fluroscence signals are shown with empty markers, while the results from first smoothed data are shown with filled markers.

Acknowledgments
This image is the copyrighted work of the attributed author or publisher, and ZFIN has permission only to display this image to its users. Additional permissions should be obtained from the applicable author or publisher of the image. Full text @ Elife