
|
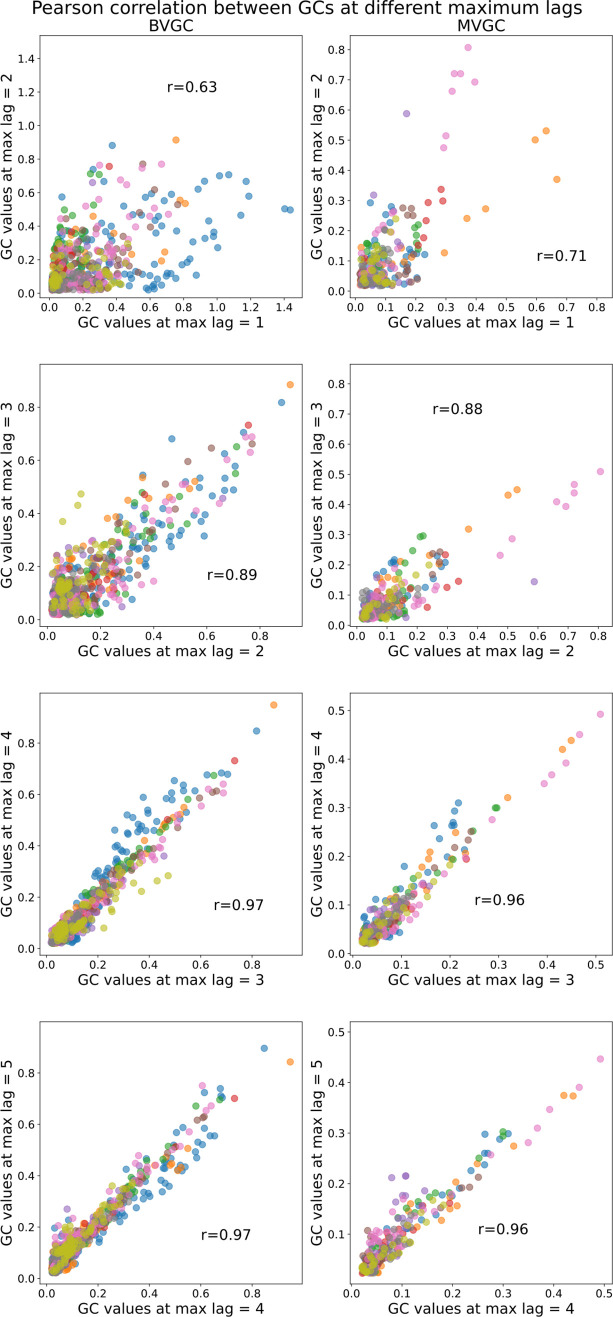
Figure 2—figure supplement 1.
Comparison of Granger causality analysis results at different maximum lags. Correlation between the GC values obtained for each pair of neurons using max lag L and max lag L + 1. All fish (n=9) of the motoneuron data set are used and represented by color (same as in Figure 7). The similarity in Granger causality values, measured by the Pearson correlation coefficient r, increases as L increases and then stabilizes after maximum lag L = 3 (r = 0.97 both for BVGC and MVGC between L = 3 and L = 4, as well as between L = 4 and L = 5), justifying our decision to use L = 3. Using a larger maximum lag does not bring more information but brings more complexity, and increases the computation time (especially for MVGC).