
Image
|
Figure Caption
Figure 1—figure supplement 5.
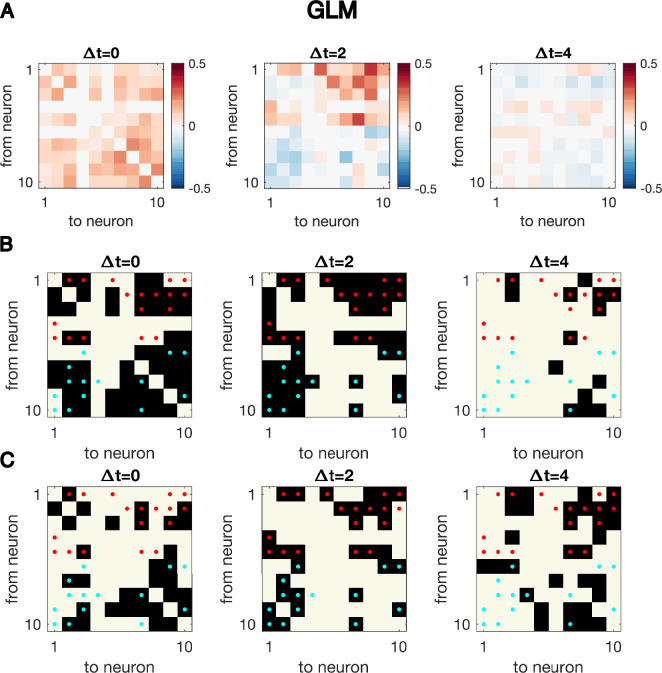
Same as 1—figure supplement 4, but for synthetic data generated using GLM dynamics with N = 10 neurons for T = 5000 time points, the exact same simulated dynamics as used to plot Figure 1EF. Even at the true time difference, Δt = 2 , the significant cross-correlation over-identifies true connectivity.
Acknowledgments
This image is the copyrighted work of the attributed author or publisher, and
ZFIN has permission only to display this image to its users.
Additional permissions should be obtained from the applicable author or publisher of the image.
Full text @ Elife