
Fig. 6
- ID
- ZDB-IMAGE-230319-48
- Publication
- Lou et al., 2023 - Increased circulating uric acid aggravates heart failure via impaired fatty acid metabolism
- All Figures
- Figures for Lou et al., 2023
|
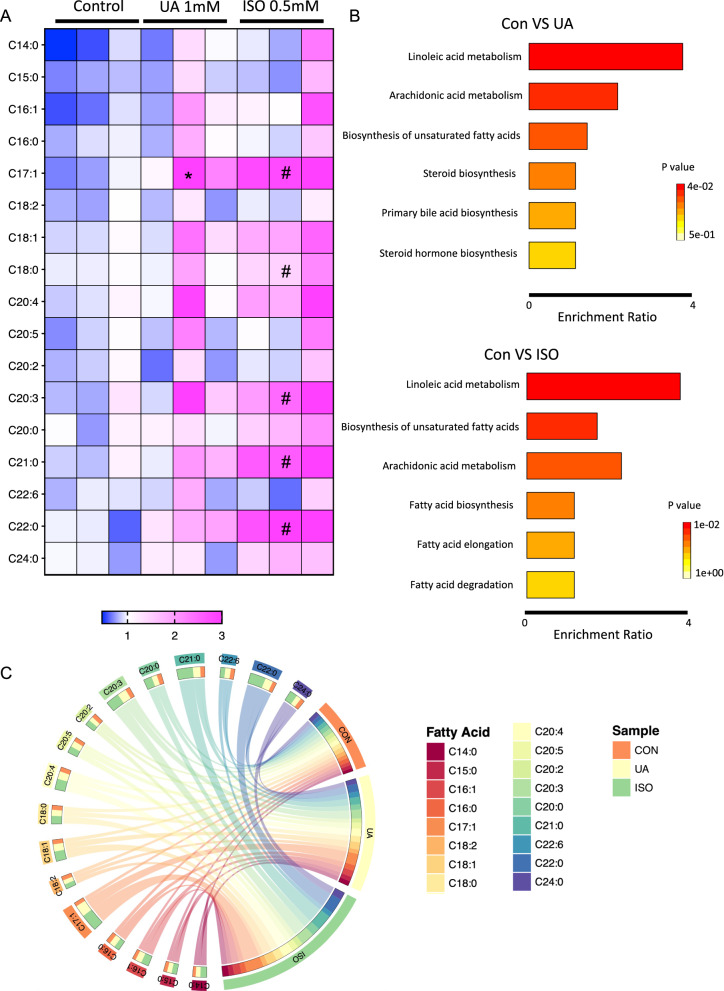
Fig. 6
Uric acid and ISO induced heart failure leads to impaired fatty acid metabolism in zebrafish. A Heatmap of several increased fatty acids in UA and ISO induced heart failure zebrafish larvae at 96 hpf. The color in each cell represents the expression of each zebrafish cluster sample as the scale bar showed, each zebrafish cluster includes 50 zebrafish larvae. For statistical analysis, two-way analysis of variance (ANOVA) followed by Holm-Sidak test was used to evaluate the statistical significance of differences among three groups. *: Con versus UA p < 0.05; #: Con versus ISO p < 0.05; B Enrichment analysis of fatty acid profiles and TOP6 pathways between Con versus UA and Con versus ISO group. C Circos plot of fatty acids among each group