
Image
|
Figure Caption
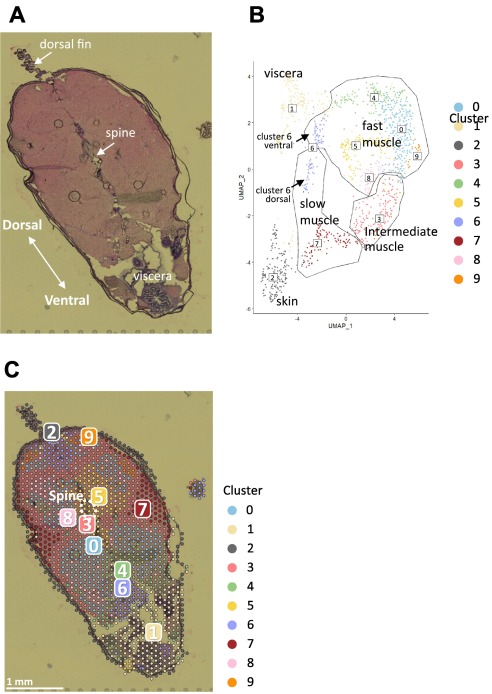
Fig. 2 Fig. 2. Clustering and reduction in the dimensionality of spots in the adult zebrafish section. A, microscope image of the adult zebrafish section on the Visium slide. B, UMAP dimensionality reduction of all spots based on their whole-gene expression patterns. Based on the UMAP clustering, spots were clustered into 10 clusters numbered from 0 to 9. Cluster 6 was subdivided into dorsal and ventral regions based on their location and UMAP positions (see Fig. 4). C, location of each spot color-coded by clusters in the section. The number indicates each cluster.
Acknowledgments
This image is the copyrighted work of the attributed author or publisher, and
ZFIN has permission only to display this image to its users.
Additional permissions should be obtained from the applicable author or publisher of the image.
Full text @ Genomics