
|
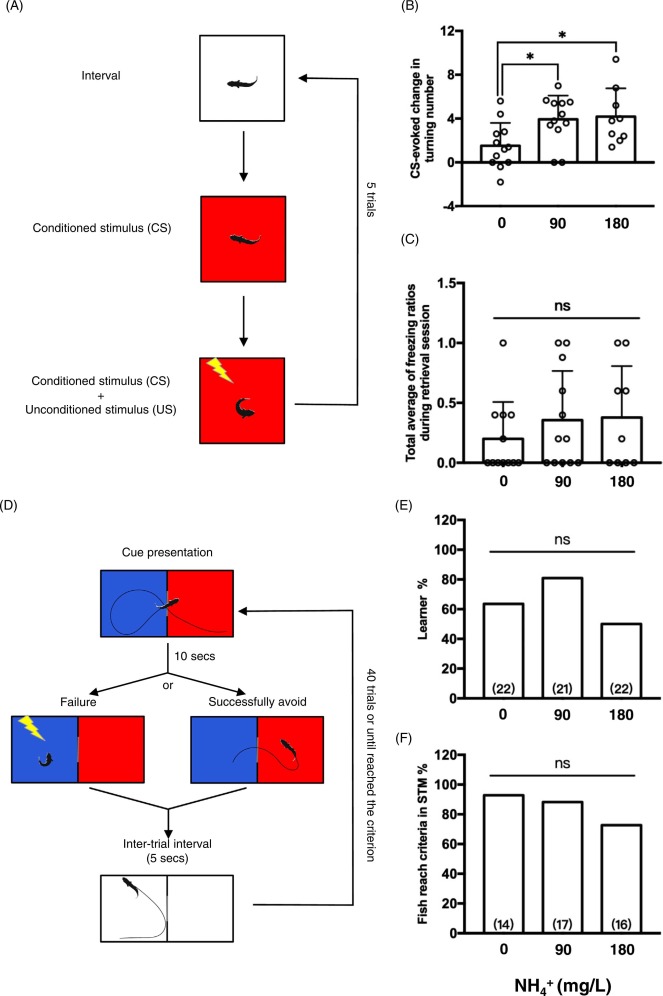
Fig. 4
Fig. 4. Cued-fear conditioning and learning and memory behaviors of zebrafish after treatment with ammonia for 4 h. (A) Schematic illustration of the cued-fear conditioning test. The number of times turning (B) and the freezing ratio during a retrieval session (C) of the 0, 90, and 180 mg/L (NH4+) groups. The number of times turning increased after 90, and 180 mg/L (NH4+) exposure. (D) Schematic illustration of the system of the active-avoidance test. (E) Ratio of fish which satisfied the success criteria (learner; 90 % avoidance in 10 sequential trials by the third training session in the active-avoidance task). There were no differences among the groups. (F) Ratio of fish that achieved the criterion in the short-term memory (STM) test. There were no differences among the 0, 90, and 180 mg/L (NH4+) groups. (B and C) Data are shown as the mean ± SD. * Indicate a significant difference from 0 mg/L, according to a one-way ANOVA with Tukey’s pair-wise comparison, p < 0.05. (B and C). NS, not significant according to a Chi-squared test (E and F).