
|
Fig. 1
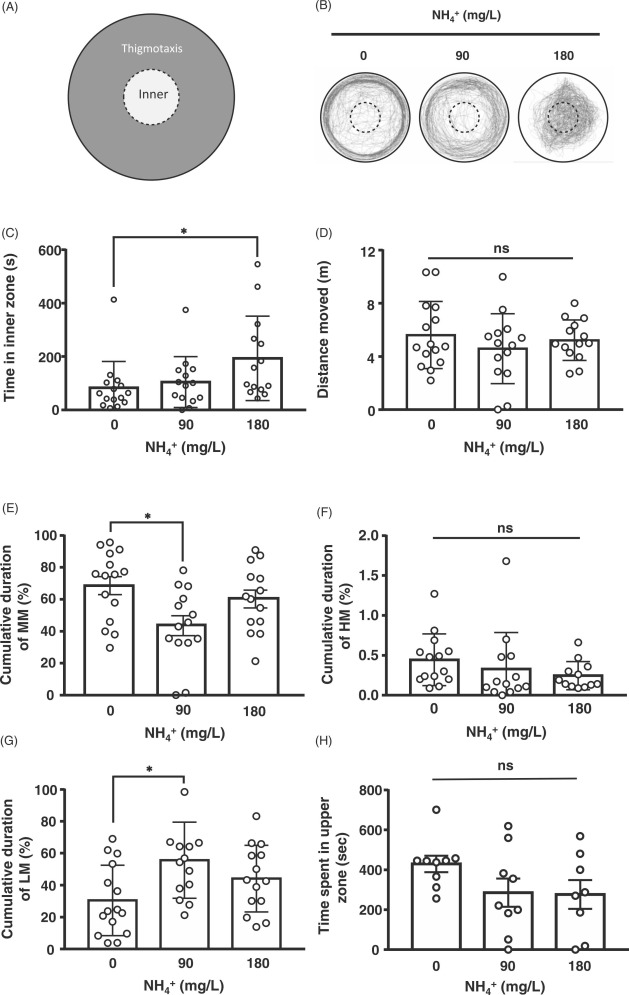
Fig. 1. Effects of 4 h of ammonia exposure in the open-field test in zebrafish. (A) Schematic illustration of the arena, which was divided into inner and outer regions for data analysis. (B) Trajectories of fish moving under exposure to 0, 90 and 180 mg/L (NH4+) (C) The time spent in the inner zone of the arena increased in fish exposed to 180 mg/L (NH4+). (D) The total moving distance in fish did not differ among the 0, 90 and 180 mg/L groups. Locomotor activity was divided into three states according to average individual velocity per trial as followed: (E) The percentage of cumulative duration of moderate mobility (MM), 20–80 %; (F) The percentage of cumulative duration of high mobility (HM), > 80 %; (G) The percentage of cumulative duration of low mobility (LM), < 20 %. (H) Effects of 4 h of ammonia exposure in the novel tank test in zebrafish. The time spent in upper zone (sec) was similar in all zebrafish. Data are shown as the mean ± SD. * Indicates a significant difference from the control (0 mg/L) by a one-way ANOVA with Tukey’s pair-wise comparison, p < 0.05. NS, not significant.