
|
Fig. 2
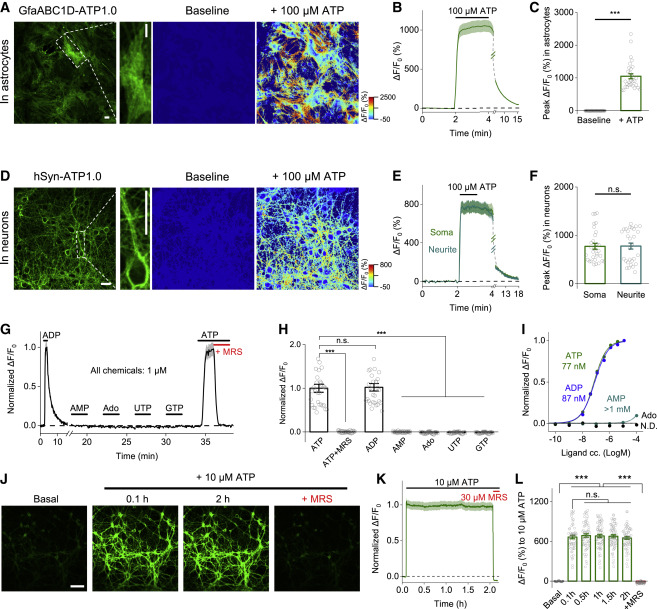
Figure 2. Characterization of the GRABATP1.0 sensor in primary cultured astrocytes and neurons (A–C) ATP1.0 was expressed in cultured cortical astrocytes and measured using confocal imaging. (A) Raw GFP fluorescence image (left) and pseudocolor images of the baseline and peak response (ΔF/F0) to 100 μM ATP. (B) Time course of ΔF/F0; 100 μM ATP was applied where indicated. (C) Summary of the peak ΔF/F0 measured before and after application of 100 μM ATP; n = 30 regions of interest (ROIs) each from three coverslips. (D–F) Same as (A)–(C), except ATP1.0 was expressed in cultured rat cortical neurons; n = 30 ROIs each from three coverslips. (G–I) Normalized ΔF/F0 measured in cultured neurons expressing ATP1.0, showing an example trace (G), summary data (H), and dose-response curves with corresponding EC50 values (I). UTP, uridine triphosphate; GTP, guanosine triphosphate; N.D., not determined. n = 30–91 ROIs from three coverslips (H and I). (J–L) Fluorescence image (J), trace (K), and summary (L) of ATP1.0 expressed in cultured hippocampal neurons during a 2 h application of 10 μM ATP; n = 60 neurons from three coverslips. Scale bars represent 30 μm (A and D) and 100 μm (J). Summary data are presented as mean ± SEM. The data in (C) and (F) were analyzed using Student’s t test; the data in (H) and (L) were analyzed using one-way ANOVA followed by Bonferroni’s multiple-comparison test; ∗∗∗p < 0.001; n.s., not significant. See also Figures S3 and S6.