
Image
|
Figure Caption
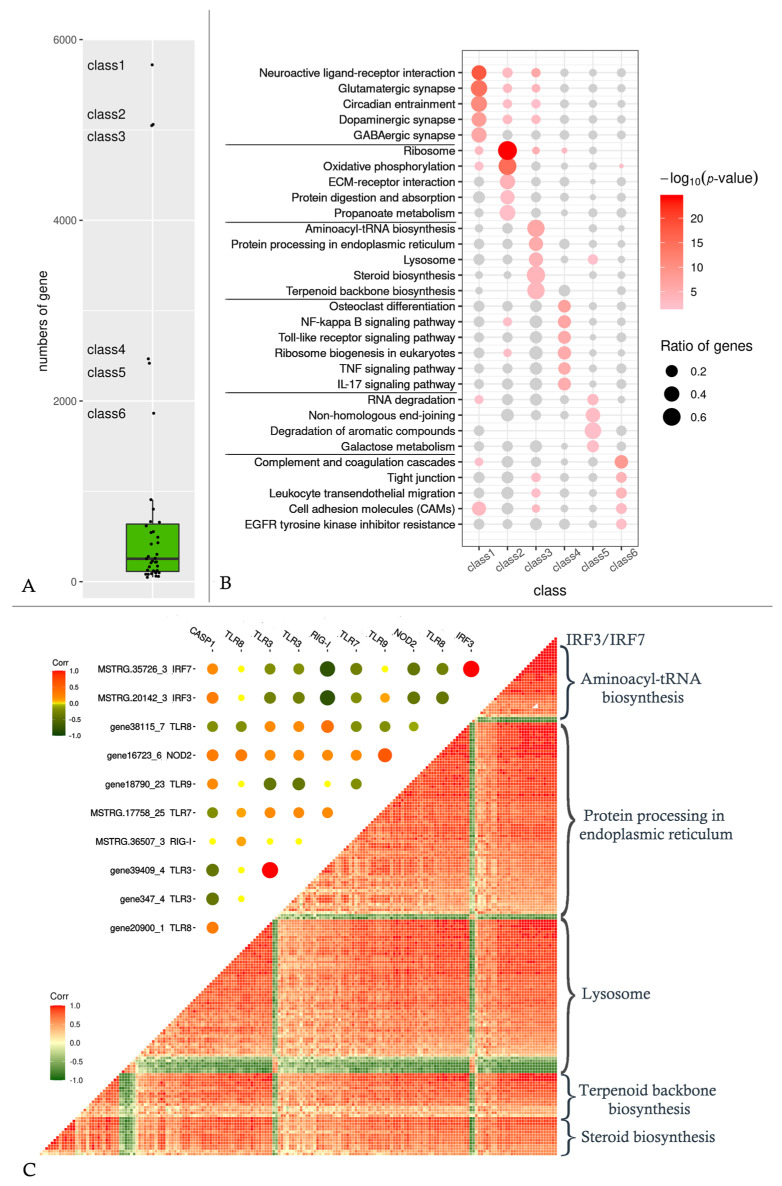
Figure 5
The curation of WGCNA analysis. (A) The scatter boxplot of gene counts for 39 classes. (B) The KEGG enrichment of the 6 outlier classes. The y-axis shows the top 5 enriched pathways of each class and the bubbles show the enrichment of the 6 classes on these selected pathways. (C) Upper triangle shows the correlation coefficients between IRF3/IRF7 and PRRs. The naming rule for the y-axis is GeneID_class NO. Symbol, and the tag of the x-axis is simplified to symbol. Lower triangle shows the correlation coefficients between IRF3/IRF7 and the genes in the top 5 enriched pathways of class 3.
Acknowledgments
This image is the copyrighted work of the attributed author or publisher, and
ZFIN has permission only to display this image to its users.
Additional permissions should be obtained from the applicable author or publisher of the image.
Full text @ Int. J. Mol. Sci.