
|
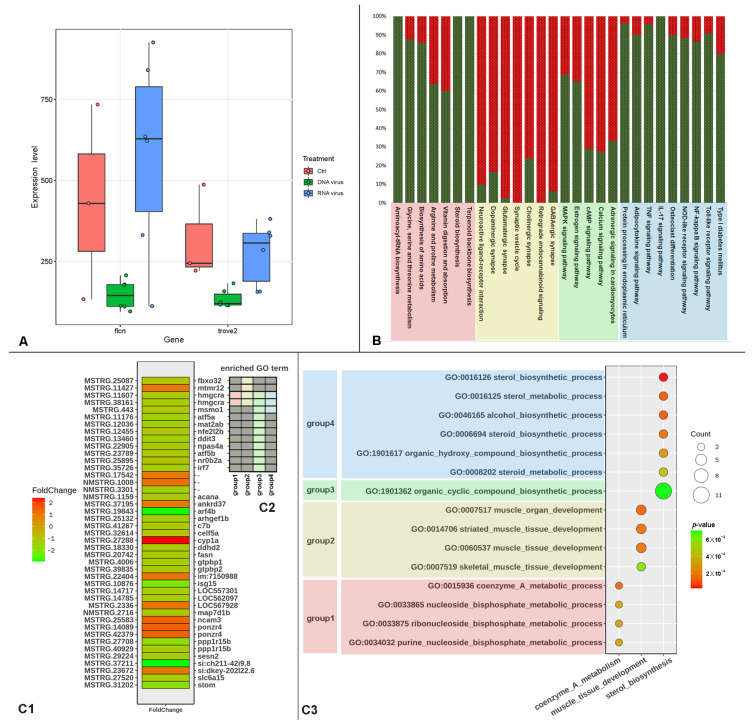
Figure 4
Summary of DEG analysis by dimensions. (A) Expression levels of two DEGs between DNA virus and RNA virus. (B) Percentage stacked bar chart of the enriched pathways based on DEGs between infections by two RNA viruses. Red block: metabolic-related pathways. Yellow block: nerve signal transmission pathways. Green block: signal transduction pathways. Blue block: immune-related pathways. (C) DEGs and enriched GO terms between the infections by two DNA viruses. (C1) The heat map of the log2 (fold change) of 43 DEGs with nr alignments. (C2) Grid graph to show DEGs corresponding to the four groups of enriched GO terms. (C3) The first 15 enriched GO terms of biological process (BP) with the lowest p-value. The x-axis is for the function categories of the GO terms. The y-axis coordinate was the four groups of GO terms.