
Image
|
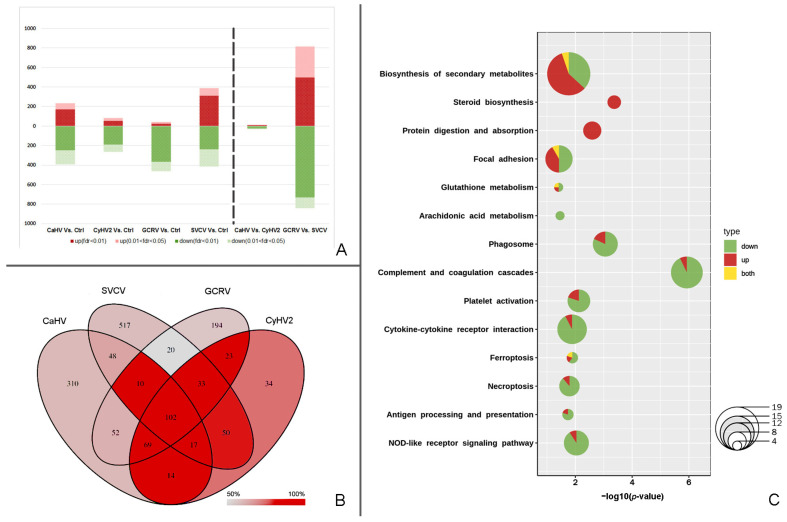
Figure Caption
Figure 1
Summary diagrams of DEGs and PBGs. (A) Stacked bars of DEGs. (B) The Venn diagram of DEGs in the infections by four viruses. The depth of red is in accord with the proportion of PBGs. (C) Bubble pie chart of enriched pathways based on PBGs. Red indicates upregulated PBGs, green indicates downregulated PBGs, and yellow indicates genes with multiple copies, some of which are upregulated and the others downregulated.
Acknowledgments
This image is the copyrighted work of the attributed author or publisher, and
ZFIN has permission only to display this image to its users.
Additional permissions should be obtained from the applicable author or publisher of the image.
Full text @ Int. J. Mol. Sci.