
Fig 6
- ID
- ZDB-IMAGE-230312-9
- Publication
- Holman et al., 2023 - A behavioral and modeling study of control algorithms underlying the translational optomotor response in larval zebrafish with implications for neural circuit function
- All Figures
- Figures for Holman et al., 2023
|
Fig 6
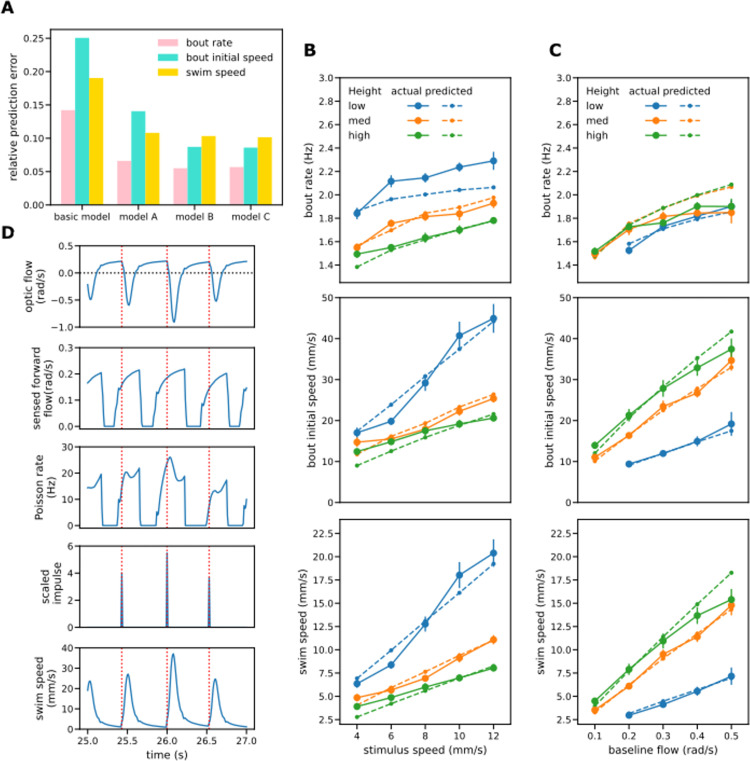
(A) Relative prediction errors for the basic single factor model and the three variants of the dual factor model. All variants of the dual factor model predicted both bout measures and swim speeds better than the single factor model. Variant C that processes only forward flow gave lower prediction errors than variant A and similar ones to the more general variant B, suggesting its adoption as the preferred model. (B-C) Comparison of observed bout rates, bout speeds and mean swim speeds with those predicted by variant C of the dual process model. In general, a good fit is achieved to the observed values for both OMR regulation (B) and the baseline flow procedures (C). (D) Sample signal traces generated by variant C of the two-factor model when height is intermediate (32mm) and stimulus speed 8 mm/s. Red dotted lines indicate times of bout initiation.