
Fig 4
- ID
- ZDB-IMAGE-230312-7
- Publication
- Holman et al., 2023 - A behavioral and modeling study of control algorithms underlying the translational optomotor response in larval zebrafish with implications for neural circuit function
- All Figures
- Figures for Holman et al., 2023
|
Fig 4
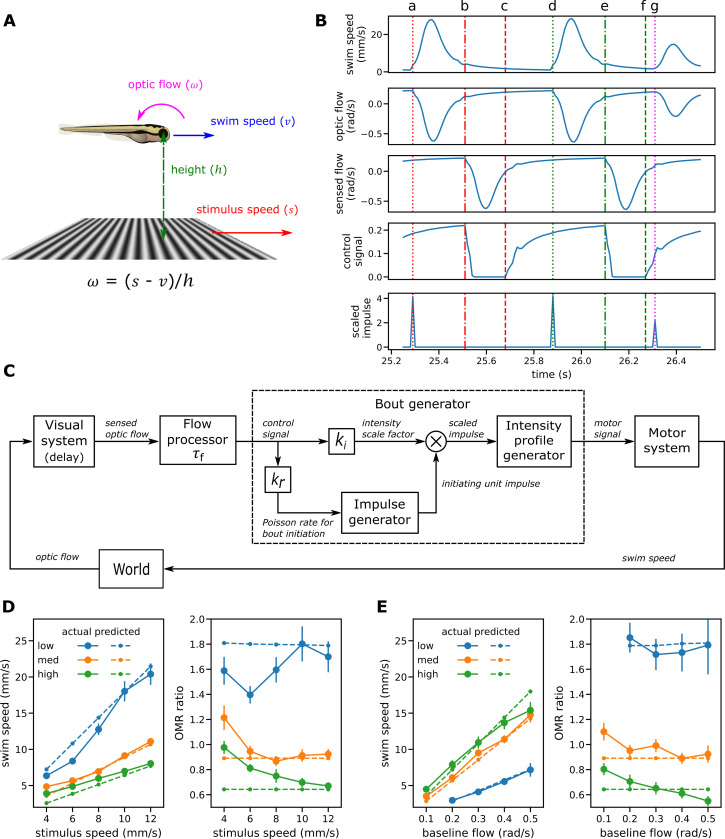
Operation of the single process model. For further details see main text and the more formal model description section of the Methods. (A) Fish swimming in the same direction as a moving grid below. The resulting translational optic flow, expressed as an angular velocity, is the ratio of the difference between grid speed and swim speed and the height of the fish above the grid, as explained in Fig 1B. (B) Sample traces generated by the single factor model. The top two traces show the observable variables swim speed and optic flow; the bottom traces show three key model variables. The vertical lines show events occurring during the first bout (red, a-c), second bout (green, d-f) and third bout (magenta, g). (C) Block diagram for the single factor model. The sensed flow is a delayed version of the actual optic flow. The flow processor smooths the sensed flow by applying leaky integration and rectifies it to produce the control signal input to the bout generator. Within the bout generator, the amplified control signal drives an impulse generator that implements a Poisson process for the event of bout initiation. The same control signal also modulates the amplitude of the initiating impulses from the impulse generator to produce scaled impulses input to the profile generator. The profile generator in turn generates a swim bout that starts when the scaled impulse is received and whose speed follows the fixed relative swim speed profile observed scaled up by the amplitude of the scaled impulse. The model has three parameters to fit to data: the time constant for leaky integration (τf) and the gains applied to the control signal to determine the Poisson rate for bout initiation events (kr) and the amplitude of scaled impulses (ki). (D-E) Comparison of swim speeds and degrees of regulation as observed in the experiments and predicted by the single factor model when fitted to mean observed swim speeds for the OMR regulation procedure (D) and the baseline flow procedure (E).