
Fig 2
- ID
- ZDB-IMAGE-230312-3
- Publication
- Holman et al., 2023 - A behavioral and modeling study of control algorithms underlying the translational optomotor response in larval zebrafish with implications for neural circuit function
- All Figures
- Figures for Holman et al., 2023
|
Fig 2
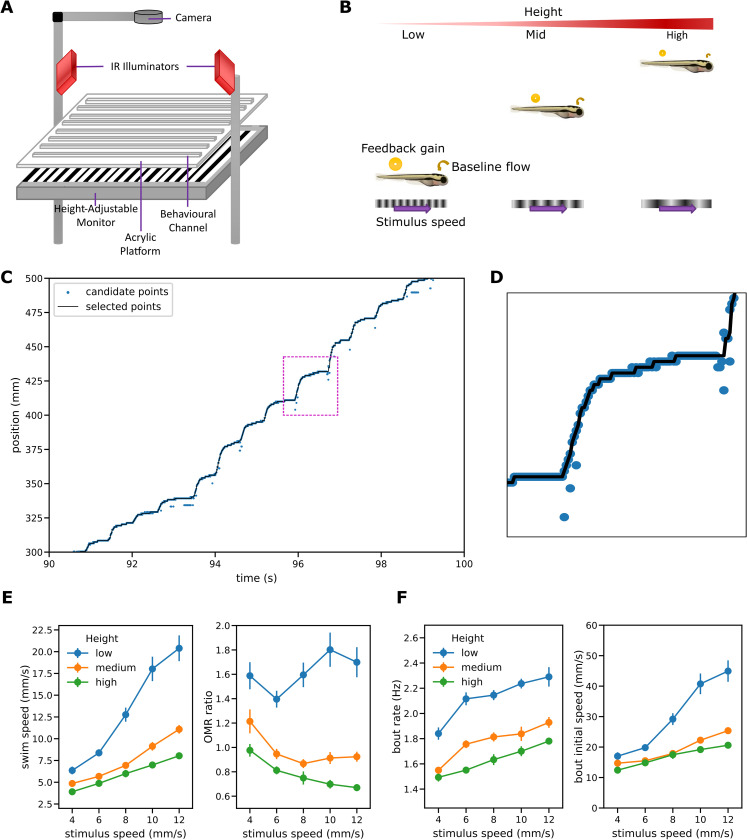
(A) Schematic illustration of the experimental apparatus. (B) OMR regulation procedure. Each fish is tested at one of three different heights and the same set of stimulus speeds. For a given stimulus speed, baseline optic flow–the optic flow experienced when the fish is at rest–and feedback gain both decrease as the height increases. (C) Sample trace showing position of the fish from the start of the channel. The light blue points show possible positions for the center of mass at each time step; the black line shows the positions selected as most probable by the tracking algorithm from those candidates. Dotted rectangle shows region shown in (D). (D) Magnified portion of trace containing a single bout. (E) Mean swim speed and OMR ratio for the OMR regulation procedure. OMR ratio is defined as the ratio of the mean swim speed observed during OMR trajectories to the speed of the grid stimulus. Error bars here and elsewhere: standard error. (F) Bout patterns for the OMR regulation procedure.