Figure Caption
Figure S11.
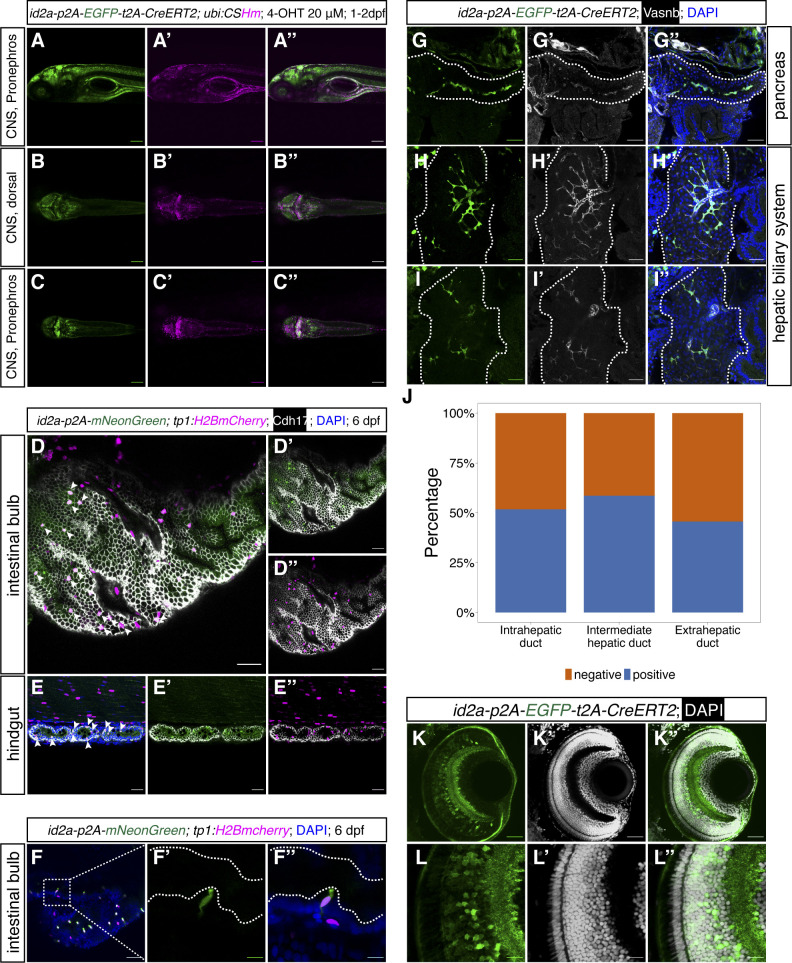
Characterization of <italic toggle='yes'>id2a</italic><sup>+</sup> cells in CNS, pronephros, intestine, hepatic biliary system, and retina.(A, B, C) Representative lateral and dorsal confocal images of id2a lineage-traced cells in the CNS and pronephros, with 4-OHT treatment from 1–2 dpf. (D, D’, D’’) Representative confocal images of immunostained id2a:mNeonGreen-positive and tp1:H2BmCherry-positive cells in the intestinal bulb. Arrowheads point to double-positive cells. (E, E’, E’’) Representative confocal images of immunostained id2a:mNeonGreen-positive and tp1:H2BmCherry-positive cells in the hindgut. Arrowheads point to double-positive cells. (F, F’, F’’) Representative and magnified images of id2a-p2amNeonGreen, tp1:H2BmCherry double-positive cells in the intestinal bulb. (F) The selected area in the white dashed square in (F) was magnified in split channels (F’, F’’). The white dashed lines outline the intestinal luminal structure. (G, H, I) Representative confocal images showing the id2a-positive cells in the intrapancreatic duct (G, G’, G’’), intrahepatic duct (H, H’, H’’), and extrahepatic duct (I, I’, I’’). (J) Quantification of the percentage id2a+ cells in intrahepatic duct, intermediate hepatic duct, and extrahepatic duct, respectively. (K, L) Representative confocal images of id2a-positive cells in the whole retina (K, K’, K’’) and magnified images in the retinal epithelial cells (L, L’, L’’). We scanned 3–5 zebrafish larvae for each tissue with 18–32 single-planes. (A, B, C, D, E, F, G, H, I, K, L) Scale bars = 200 μm (A, B, C, D, E) or 10 μm (F, K, L) or 40 μm (G, H, I).
Acknowledgments
This image is the copyrighted work of the attributed author or publisher, and
ZFIN has permission only to display this image to its users.
Additional permissions should be obtained from the applicable author or publisher of the image.
Full text @ Life Sci Alliance