
|
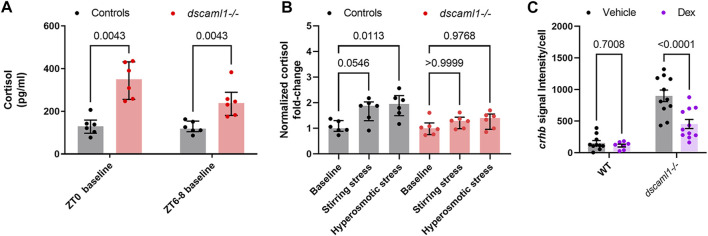
FIGURE 7
Cortisol levels and response to exogenous glucocorticoids. (A–B) Cortisol profile for 5 dpf larvae. For each sample (dot), cortisol was extracted from a pool of 30 animals. n = 6 for all groups. Median, interquartile range, and corrected p values are shown. (A) Baseline cortisol in control (black) and dscaml1−/− (red) animals. (B) Baseline-normalized cortisol fold change in control (black) and dscaml1−/− (red) animals. (C) Quantification of crhb signal intensity per cell in CRHNPO neurons. Vehicle: n = 10 (WT), 11 (dscaml1−/−). Dex: n = 7 (WT), 11 (dscaml1−/−). Mean, standard error, and corrected p values are shown.