
|
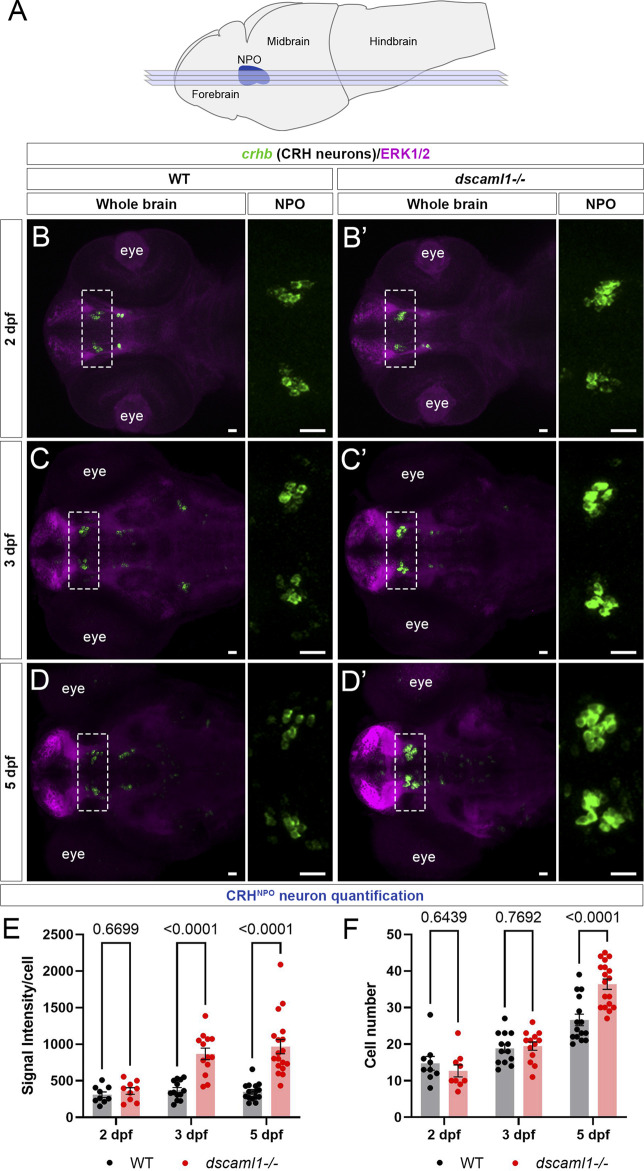
FIGURE 2
dscaml1 deficiency alters the development of CRHNPO neurons. (A) Illustration of the larval zebrafish brain (lateral view) with rostral to the left. The NPO is highlighted in blue. Imaging planes used for CRHNPO neuron analysis are shown (light blue planes) (B-D') Developmental trajectory of CRHNPO neurons, labeled by crhb FISH (green) and co-stained with anti-ERK1/2 (magenta). At each developmental stage, a representative confocal sub-stack containing the NPO is shown, with the NPO (boxed region) enlarged and shown in the right panel without the ERK1/2 co-stain. Wild-type (WT) animals are shown in panels B, C, and (D) dscaml1−/− animals are shown in panels B', C', and D' (E–F) Quantification of the signal intensity per cell (E) and cell number (F). Multiple-comparison corrected p values are as shown. WT: n = 9 (2 dpf), 13 (3 dpf), 15 (5 dpf). dscaml1−/−: n = 9 (2 dpf), 13 (3 dpf), 18 (5 dpf). Scale bars are 20 μm. Mean, standard error, and corrected p values are shown.