
Figure 1
- ID
- ZDB-IMAGE-230228-95
- Publication
- Hu et al., 2023 - Transcriptomic and Metabolomic Studies Reveal That Toll-like Receptor 2 Has a Role in Glucose-Related Metabolism in Unchallenged Zebrafish Larvae (Danio rerio)
- All Figures
- Figures for Hu et al., 2023
|
Figure 1
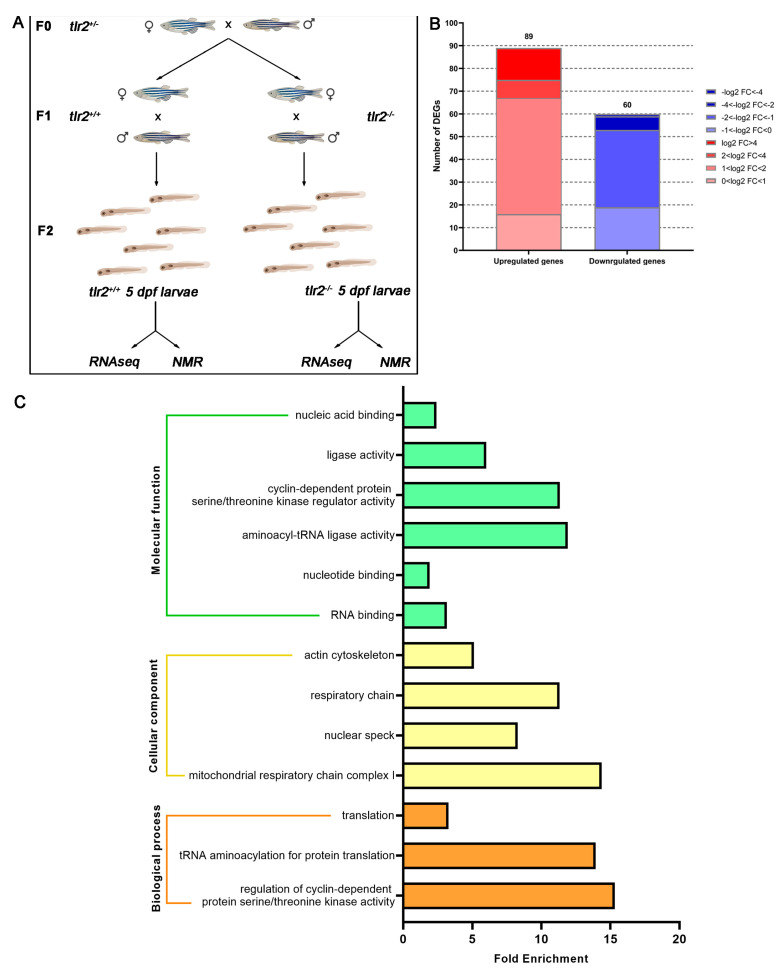
Experimental setup scheme and overview of the RNAseq in tlr2 mutant zebrafish larvae. (A) Setup of the RNAseq and 1H NMR experiment. (B) Overview of the distribution of differentially expressed genes (DEGs) log2 fold change in tlr2−/− versus tlr2+/+ zebrafish larvae. DEGs were assessed by S value ≤ 0.005. Upregulated gene sets are shown in red, and downregulated gene sets are shown in blue. The intensity of color represents the log2 fold change level. (C) Gene ontology (GO) analysis. Significantly enriched GO terms for DEGs of tlr2−/− versus tlr2+/+ groups were determined by using the hypergeometric test/Fisher’s exact test, with a threshold of p value < 0.05 which were adjusted using the Benjamini and Hochbery FDR correction. Genes were categorized according to specific molecular functions, cellular components, and biological processes.