
|
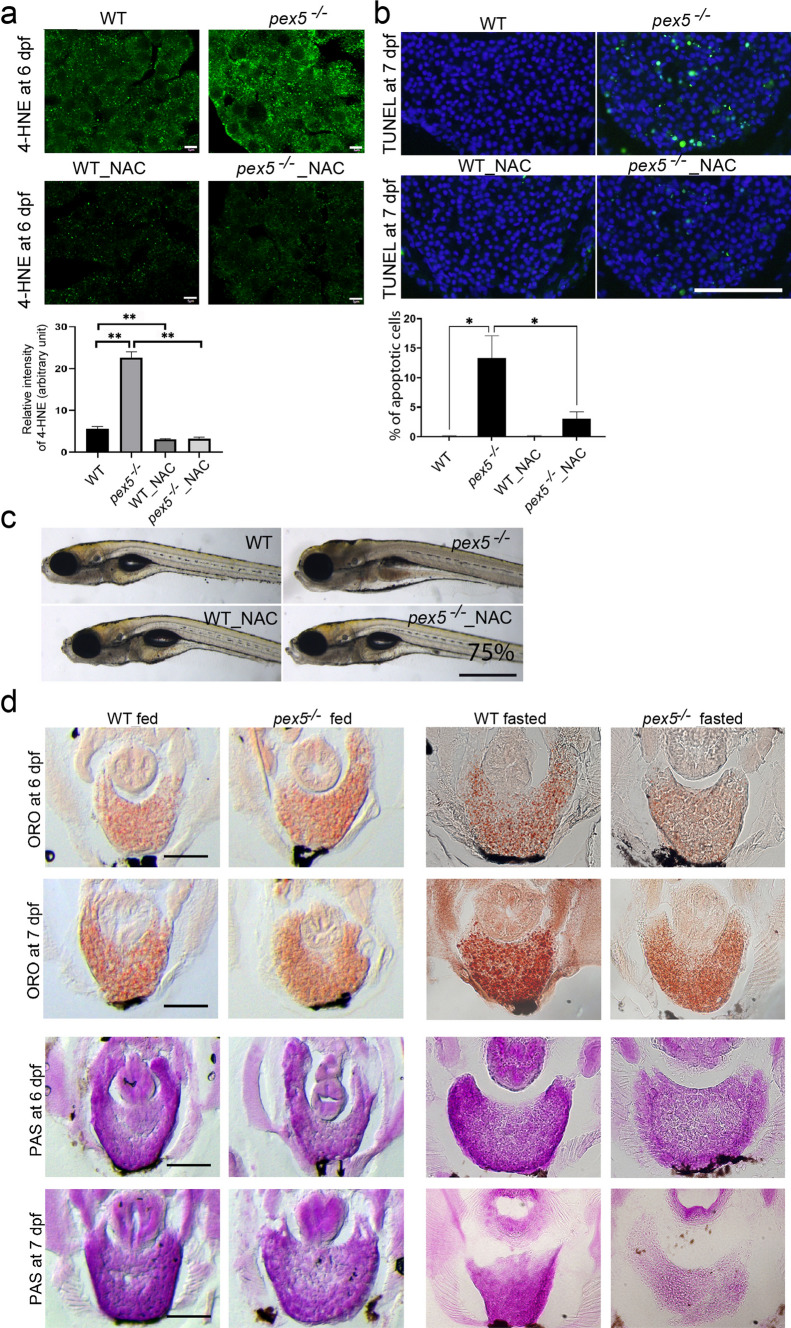
Fig. 4
Fasting induces ROS and abnormally increased consumption of hepatic lipids and glycogen in the pex5−/− liver. a 4-hydroxynonenal (4-HNE) was performed in the liver sections of WT and pex5−/− zebrafish at 6 dpf either untreated or treated with 100 μM N-acetyl-cysteine (NAC). Scale bar = 5 μm. Graph shows quantified signal intensity and presented as the average with error bars indicating standard deviation. Statistical significance was determined using the Student’s t test in Microsoft Excel; ** indicates p values < 0.01. b Terminal deoxyribonucleotidyl transferase (TDT)-mediated dUTP nick-end labeling (TUNEL) staining was performed in the liver sections of WT and pex5−/− zebrafish at 7 dpf either untreated or treated with NAC. Positive signals appear in green, and nuclei were stained with 4ʹ, 6-diamidino-2-phenylindole (DAPI) in blue. Scale bar = 100 μm. Graph shows the percentage of apoptotic cells per different conditions with error bars indicating standard deviation. Statistical significance was determined using the Student’s t test in Microsoft Excel; * indicates p values < 0.05. c Representative images of WT and pex5−/− zebrafish at 9 dpf either untreated or treated with NAC. Larvae were shown in lateral views with anterior to the left. Scale bar = 1 mm. d ORO (upper panels) or PAS staining (lower panels) was performed in the liver sections of both fed and fasted WT and pex5−/− zebrafish at 6 and 7 dpf. Representative images are shown. Scale bar = 100 μm