
|
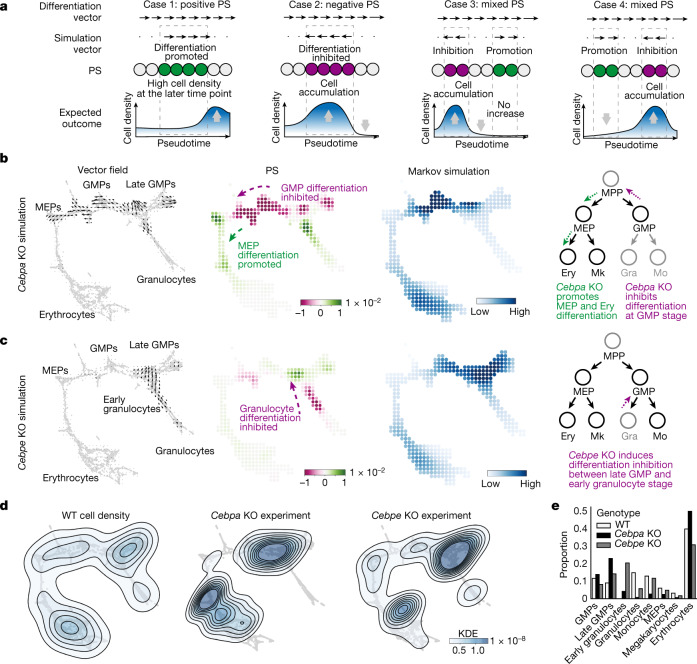
Fig. 2
a, Biological interpretation of perturbation scores (estimation of cell density based on perturbation score). Case 1: the differentiation and perturbation simulation vectors share the same direction, indicating a population shift towards a more differentiated identity. Case 2: the two vectors are opposed, suggesting that differentiation is inhibited. Case 3: predicted inhibition precedes promotion; thus, cells will be likely to accumulate. b,c, CellOracle Cebpa KO (b) and Cebpe KO (c) simulations showing cell-state transition vectors, perturbation scores and estimated cell density (Markov simulation). Right, schematics of simulated phenotype. Ery, erythrocyte. d, Ground-truth experimental cell density plot of wild-type (WT) cells, Cebpa KO cells and Cebpe KO cells in the force-directed graph embedding space. Estimated kernel density data are shown as a contour line on a scatter plot to depict cell density. e, Cell-type proportions in the WT and ground-truth KO samples. Gra, granulocyte; KDE, kernel density estimation; Mo, monocyte.