
Image
|
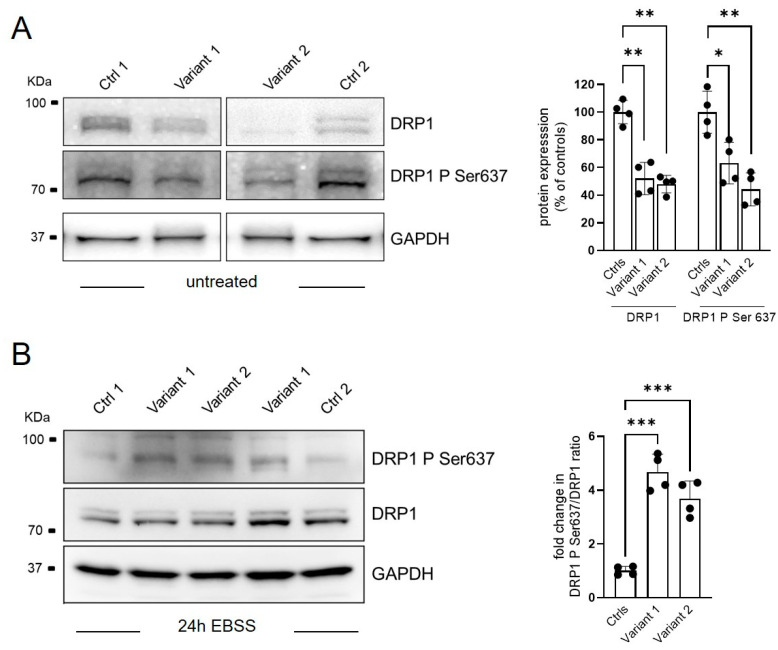
Figure Caption
Figure 3
Regulation of mitochondrial dynamics via DRP1-Ser637 phosphorylation status. Representative WB analysis of DRP1 phosphorylation process in basal condition (A) and after 24 of starvation (EBSS treatment) (B). Two different control fibroblasts and two subjects for each mutation in technical duplicate were analyzed and plotted as histograms with both mean ± SD and individual values of replicates. Ordinary ANOVA test (one-way ANOVA) was used to compare the mean levels of each mutated line with the control mean. * p < 0.05; ** p < 0.01; *** p < 0.001.
Acknowledgments
This image is the copyrighted work of the attributed author or publisher, and
ZFIN has permission only to display this image to its users.
Additional permissions should be obtained from the applicable author or publisher of the image.
Full text @ Int. J. Mol. Sci.