
|
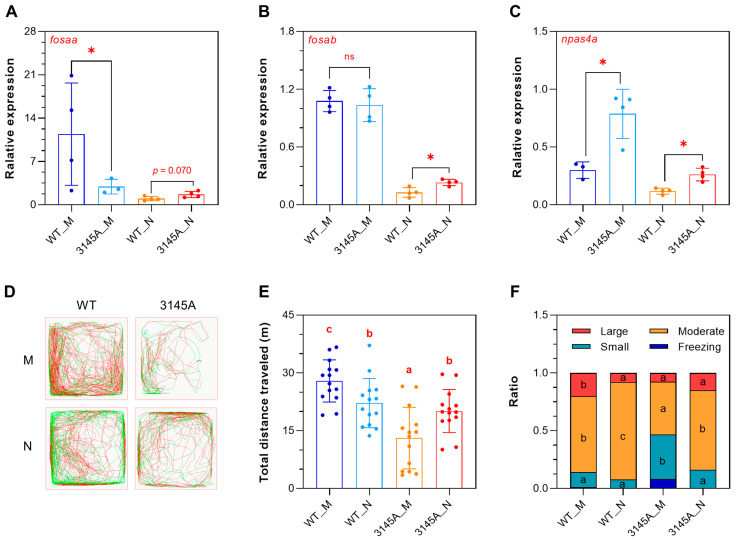
Figure 10
The prkcaa mutants are more active at night. (A–C) Expression of the representative circadian genes determined by qPCR. (A) fosaa, (B) fosab, (C) npas4a. (D) Representative tracked trajectories of the fish in the morning and at night. The red and green line segments represent large (>15 cm/s) and moderate (1–15 cm/s) movements, respectively. M, morning (9:00–11:00 a.m.); N, night (9:00–11:00 p.m.). (E) Total distance traveled. (F) Time ratio of the speed-based movement categories. The error bars represent standard error (n = 14). Different letters overlaid on the bar segments indicate significant difference between the means (* p < 0.05).