
Image
|
Figure Caption
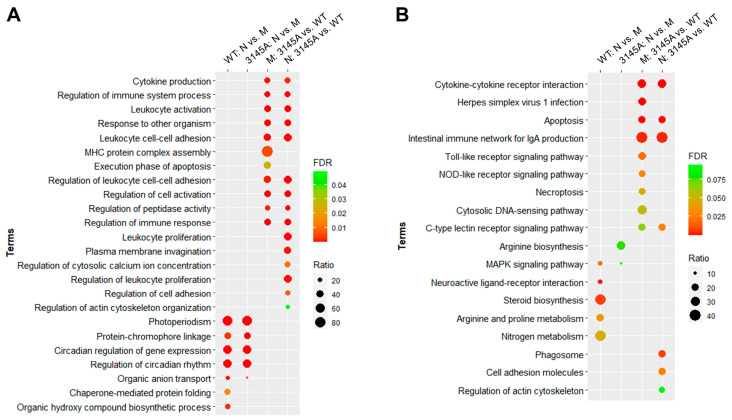
Figure 8
Top GO biological process and KEGG pathway enrichments for the DEGs. (A) Top GO biological process terms. (B) Top KEGG pathway terms. FDR, false discovery rate; ratio, proportion of the DEGs to all the genes associated with the corresponding functional term. Only terms with FDR < 0.05 are shown.
Acknowledgments
This image is the copyrighted work of the attributed author or publisher, and
ZFIN has permission only to display this image to its users.
Additional permissions should be obtained from the applicable author or publisher of the image.
Full text @ Int. J. Mol. Sci.