
|
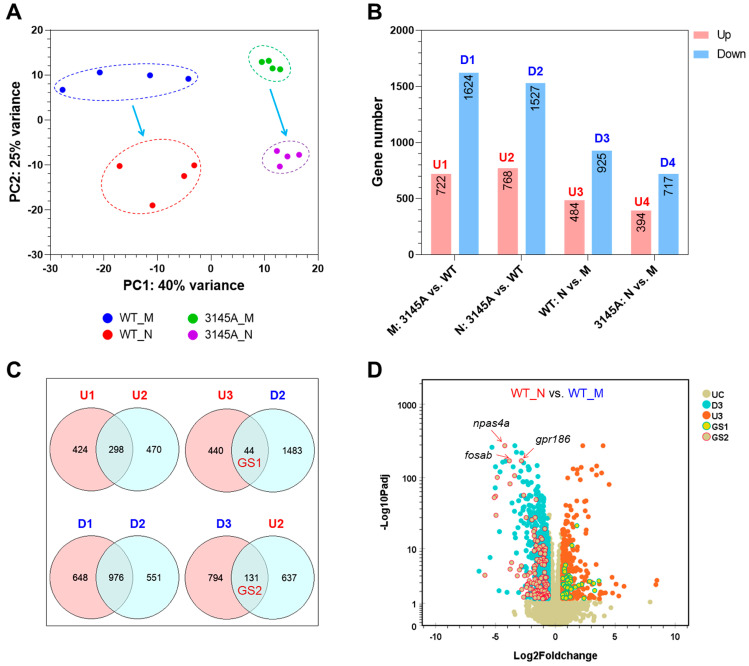
Figure 7
Effects of prkcaa mutation on gene expression. (A) Results of PCA. The proportion of variance explained by the first two PCs is displayed. (B) Numbers of the differentially expressed genes (DEGs). U1 to U4, the upregulated (up) gene sets; D1 to D4, the downregulated (down) gene sets. M and N represent the sampling time; M, morning (9:00 a.m.); N, night (9:00 p.m.). (C) Venn diagrams indicating the intersection between the gene sets. GS1 and GS2 represent the circadian genes regulated by the prkcaa mutation. (D) A volcano plot demonstrating the DEGs of the indicated gene sets. UC, unchanged; D3 and U3, the same as in (B); GS1 and GS3, the same as in (C). The representative circadian genes downregulated at night and upregulated by the prkcaa mutation are indicated.