
|
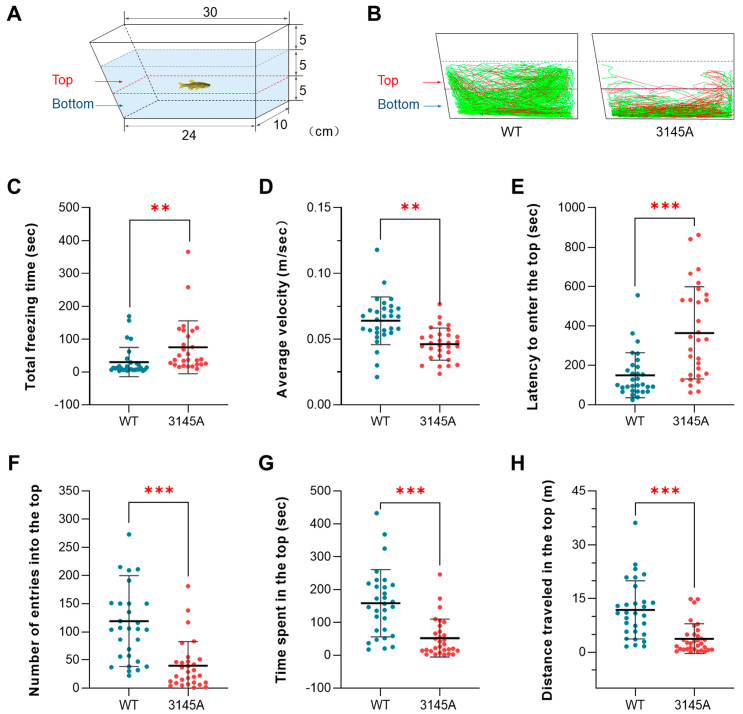
Figure 3
The prkcaa−/− mutants demonstrated anxiety-like behavior. (A) A diagram for the novel tank. The tank was divided into 2 parts with a dashed red line: the top and the bottom. The numbers indicate tank size and water depth (cm). (B) Representative tracked trajectories of the WT and 3145A fish. The red and green line segments represent large (>15 cm/s) and moderate (1–15 cm/s) movements, respectively. (C) Total freezing time. (D) Average velocity. (E) Latency to enter the top. (F) Number of entries into the top. (G) Time spent in the top. (H) Distance traveled in the top. The error bars represent standard error (n = 30). **, p < 0.01; ***, p < 0.001.