
|
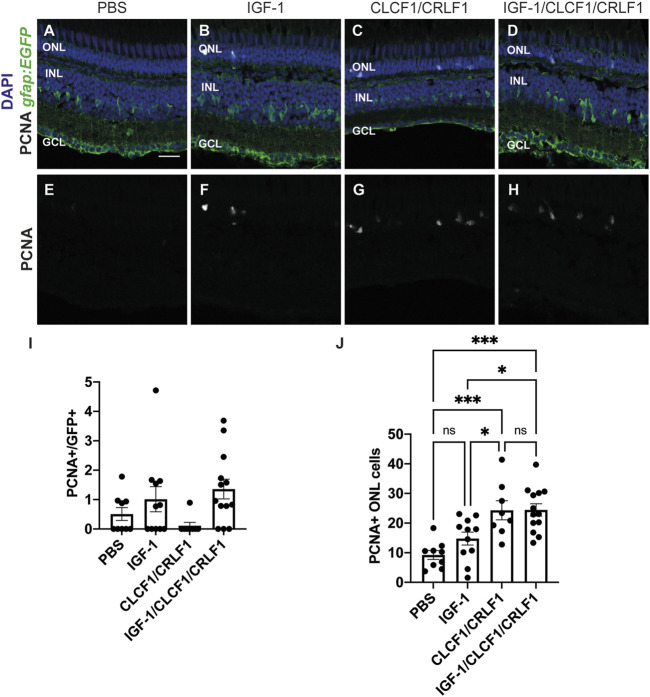
FIGURE 8
Co-injection of CLCF/CRLF and IGF-1 does not induce additional proliferation. (A–D) Single confocal images from albino; Tg[gfap:EGFP] nt11 zebrafish which were intravitreally injected every 12 h with either PBS (A), IGF-1 (B), CLCF1/CRLF1 (C), or a combination of IGF-1 and Clcf1/Crlf1a (D) for 72 h. Sections were labeled for GFP and PCNA to assess proliferating Müller glia and nuclei were counterstained with DAPI (E, F, G, H). (I) Quantification showing no change in the number of PCNA-positive Müller glia within the INL of IGF-1 and IGF-1/CLCF1/CRLF1-injected retinas. (J) Quantification showing significant difference in the number of PCNA-positive cells within the ONL of IGF-1 and IGF-1/CLCF1/CRLF1-injected retinas. One-way ANOVA with Tukey post hoc, IGF-1/CLCF1/CRLF1 vs. PBS p = 0.0001, CLCF1/CRLF1 vs. PBS p = 0.0007, IGF-1 vs. CLCF1/CRLF1 p = 0.0362, IGF-1/CLCF1/CRLF1 vs. IGF-1 p = 0.0127. n ≥ 8. Mean ± SEM, *p < 0.05,***p < 0.001. ONL, outer nuclear layer, INL, inner nuclear layer, GCL, ganglion cell layer. Scale bar represents 20 µm.