
|
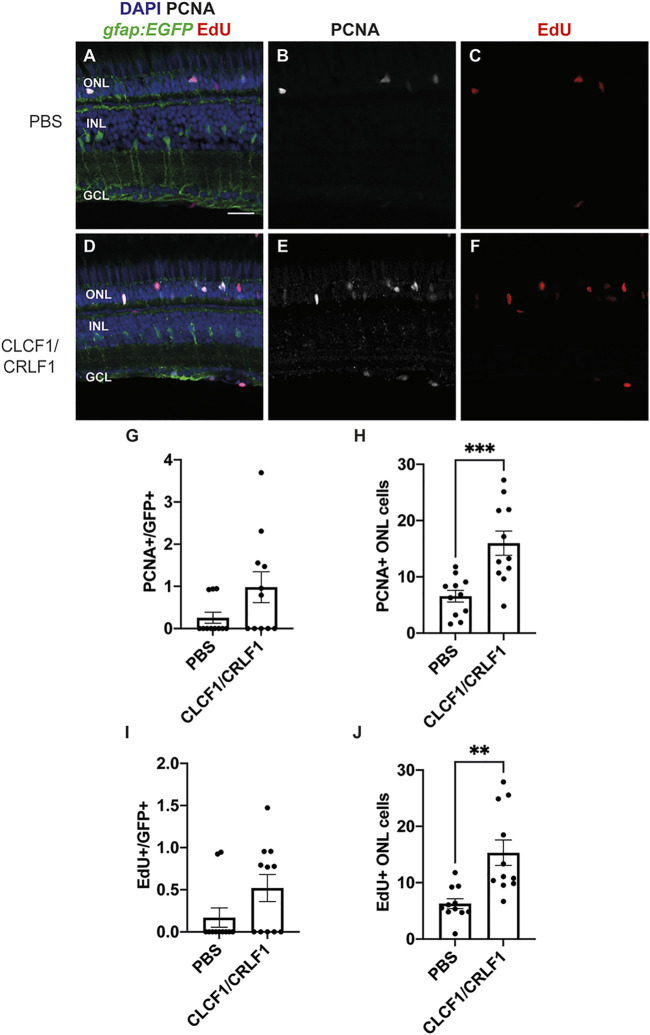
FIGURE 6
Intravitreal injection of recombinant mouse CLCF1/CRLF1 induces rod precursor cell proliferation. (A–F) Single confocal images from albino; Tg[gfap:EGFP] nt11 zebrafish which were intravitreally injected every 12 h with either PBS (A) or CLCF1/CRLF1 (D) for 72 h. Sections were labeled for GFP, PCNA, and EdU to assess proliferating Müller glia and nuclei were counterstained with DAPI (B, C, E, F). (G) Quantification showing no significant change in the number of PCNA-positive Müller glia within the INL of CLCF1/CRLF1-injected retinas. Student’s t-test, p = 0.08. (H) Quantification showing significant increase in the number of PCNA-positive cells within the ONL of CLCF1/CRLF1-injected retinas. Student’s t-test, p = 0.0008. (I) Quantification showing no significant difference in the number of EdU-positive Müller glia within the INL of CLCF1/CRLF1-injected retinas. Student’s t-test, p = 0.09. (J) Quantification showing significant increase in the number of EdU-positive cells within the ONL of CLCF1/CRLF1-injected retinas. Student’s t-test, p = 0.0014. n ≥ 11. Mean ± SEM, **p < 0.01, ***p < 0.001. ONL, outer nuclear layer, INL, inner nuclear layer, GCL, ganglion cell layer. Scale bar represents 20 µm.