
|
FIGURE 3
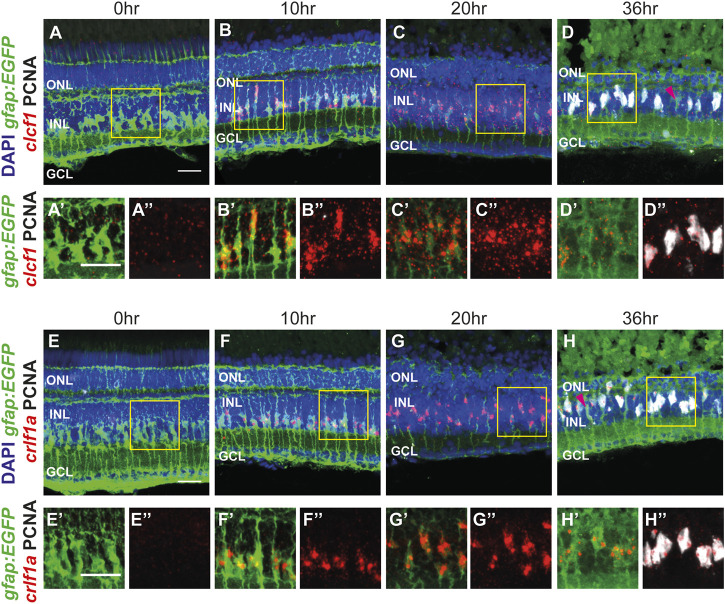
The CNTFR ligands clcf1 and crlf1a are detected within Müller glia following injury, consistent with scRNA-seq data. (A–H")Maximum projection images of dark-adapted albino; Tg[gfap:EGFP] nt11 zebrafish that were light-treated for up to 36 h, with in situ hybridization performed utilizing either clcf1 (A–D") or crlf1a (E–H") probes. Sections were also labeled for GFP and PCNA to assess proliferating Müller glia and nuclei were counterstained with DAPI. Yellow boxes in (A-H) represent areas chosen for greater magnification (in A'-H' and A"-H"). Magenta arrowheads (D, H) show resting Müller glia. ONL, outer nuclear layer, INL, inner nuclear layer, GCL, ganglion cell layer. Scale bar represents 20 µm.